FREQUENCY / First application

Project Harbor. The work in practice.

Project Harbor uses survey records to calculate how much cargo has moved. When a figure is corrected, it recalculates the quantity and keeps the earlier report. We develop it in a simulated harbour, where the same record-keeping follows the work from the water to the yard: the survey of a cargo transfer, the supply hub that stages pallets and totes, and the loading bay where they leave by trailer.

The walkthroughs below illustrate a simulated operation with generated images, not photographs of a real one. They are not connected to the survey software, live instruments or the running simulation. Captures of the simulation itself follow, labelled as such.

Configured scenario values, not field measurements.

Part one · the survey

One transfer, six phases.

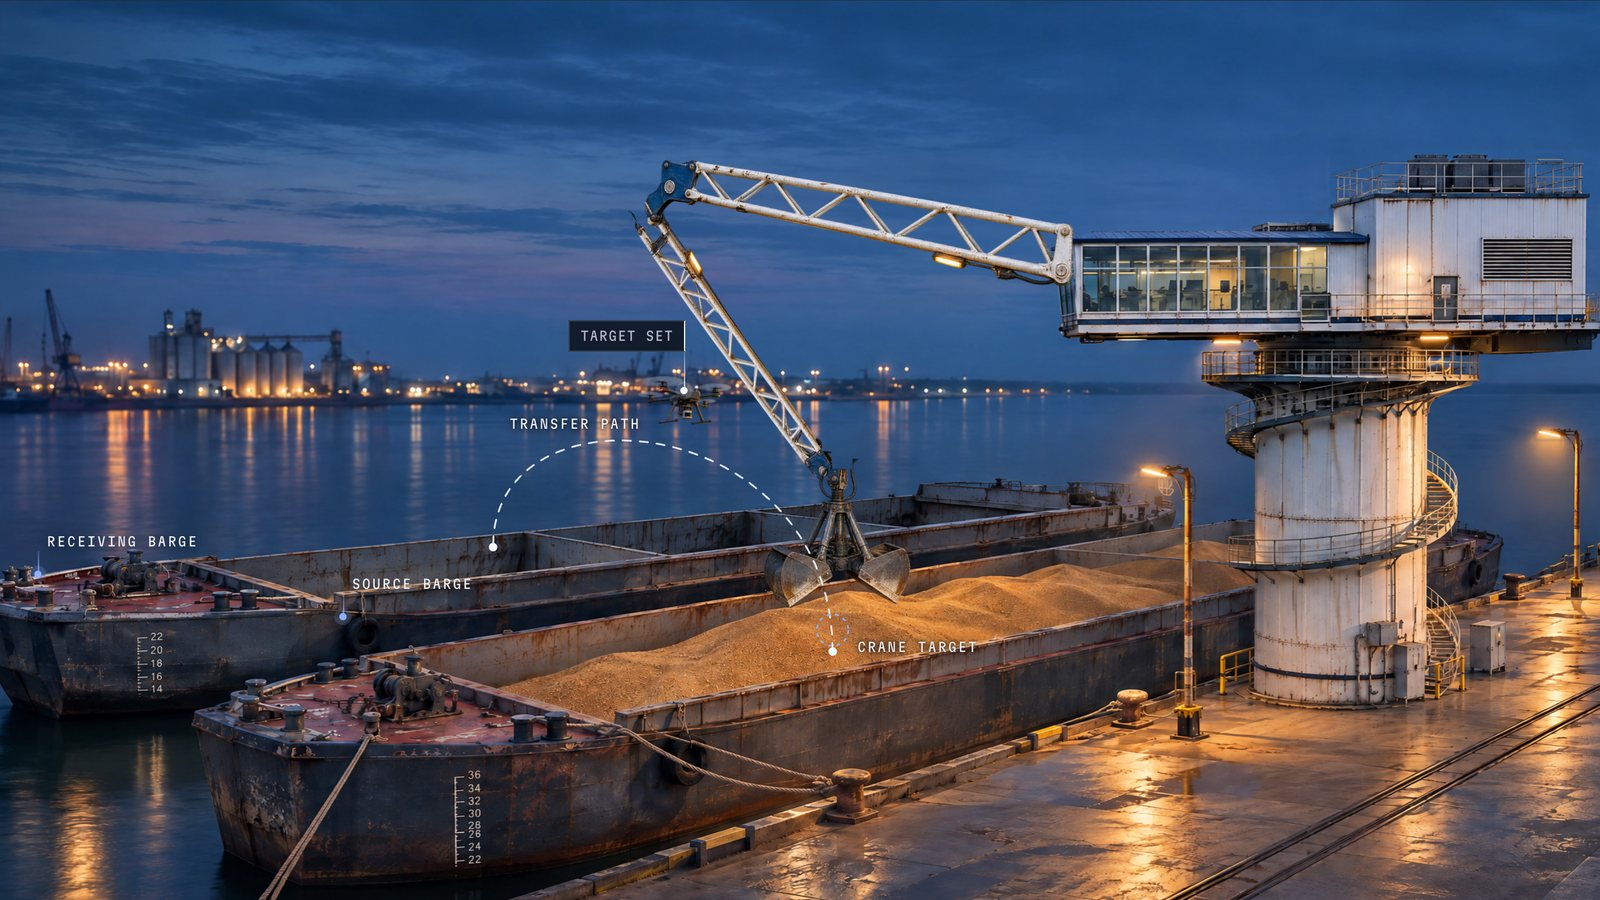
Grain moves from one barge to another, and a survey drone reads the barge before, during and after. Play it through (about 78 seconds) or step by phase, and drag the picture to shift the view. Each phase says what happens on the water, what is measured and what is recorded for review.

Mean draft
11.80 ft
Change
+0.00 ft
Loads
0 of 12
Cargo aboard
0.0 t

PHASE 01 / 06

Pre-survey

Record where the vessel starts.

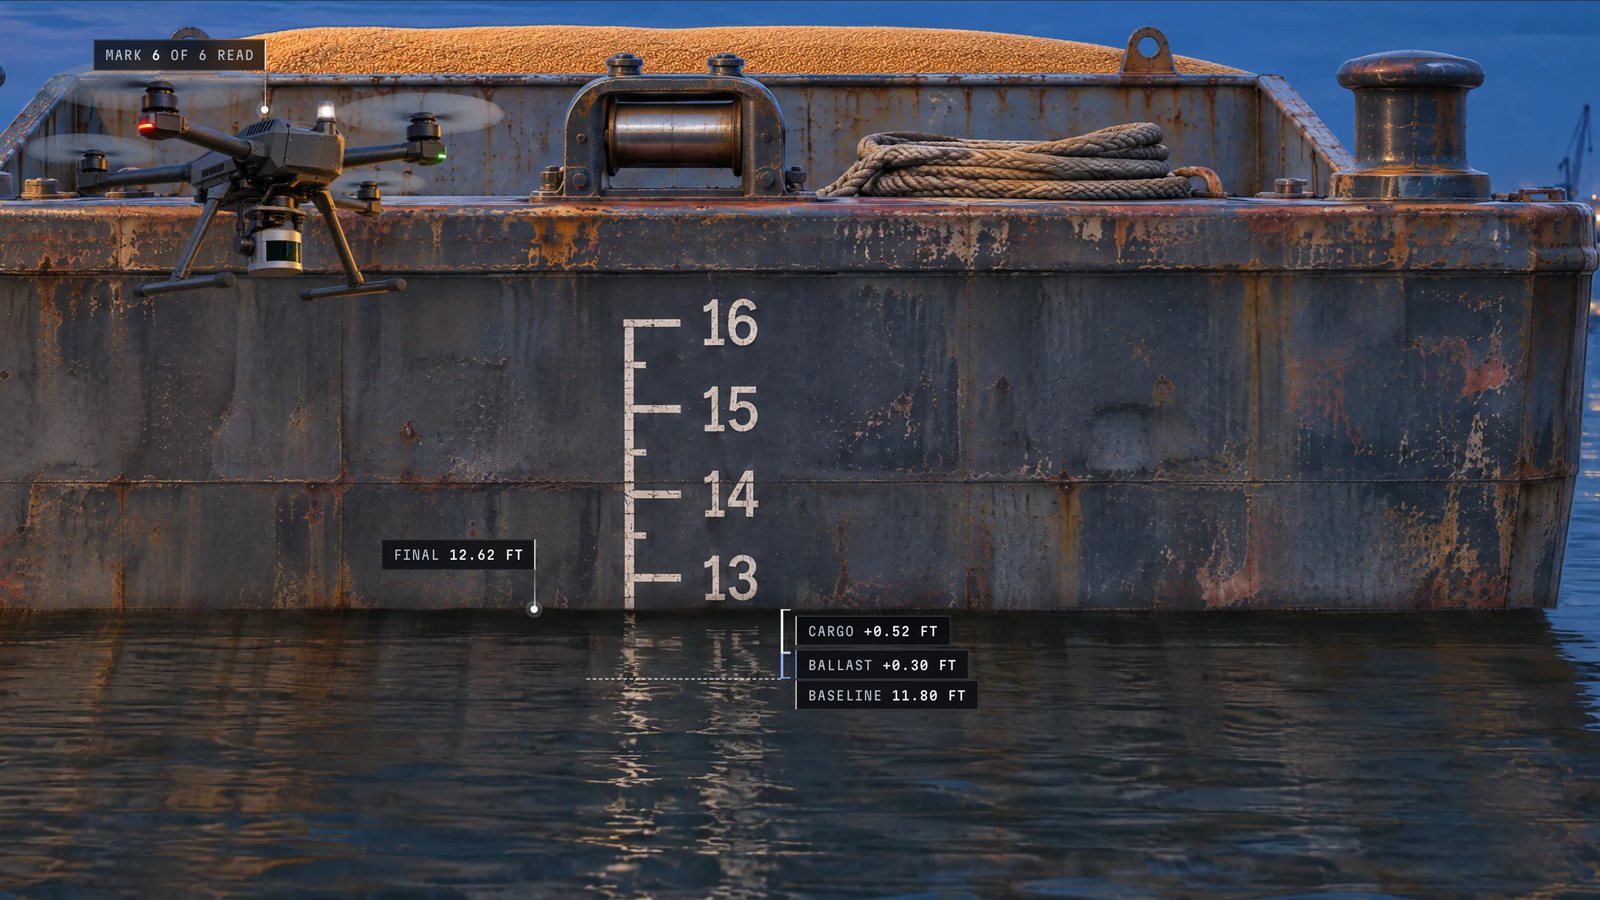
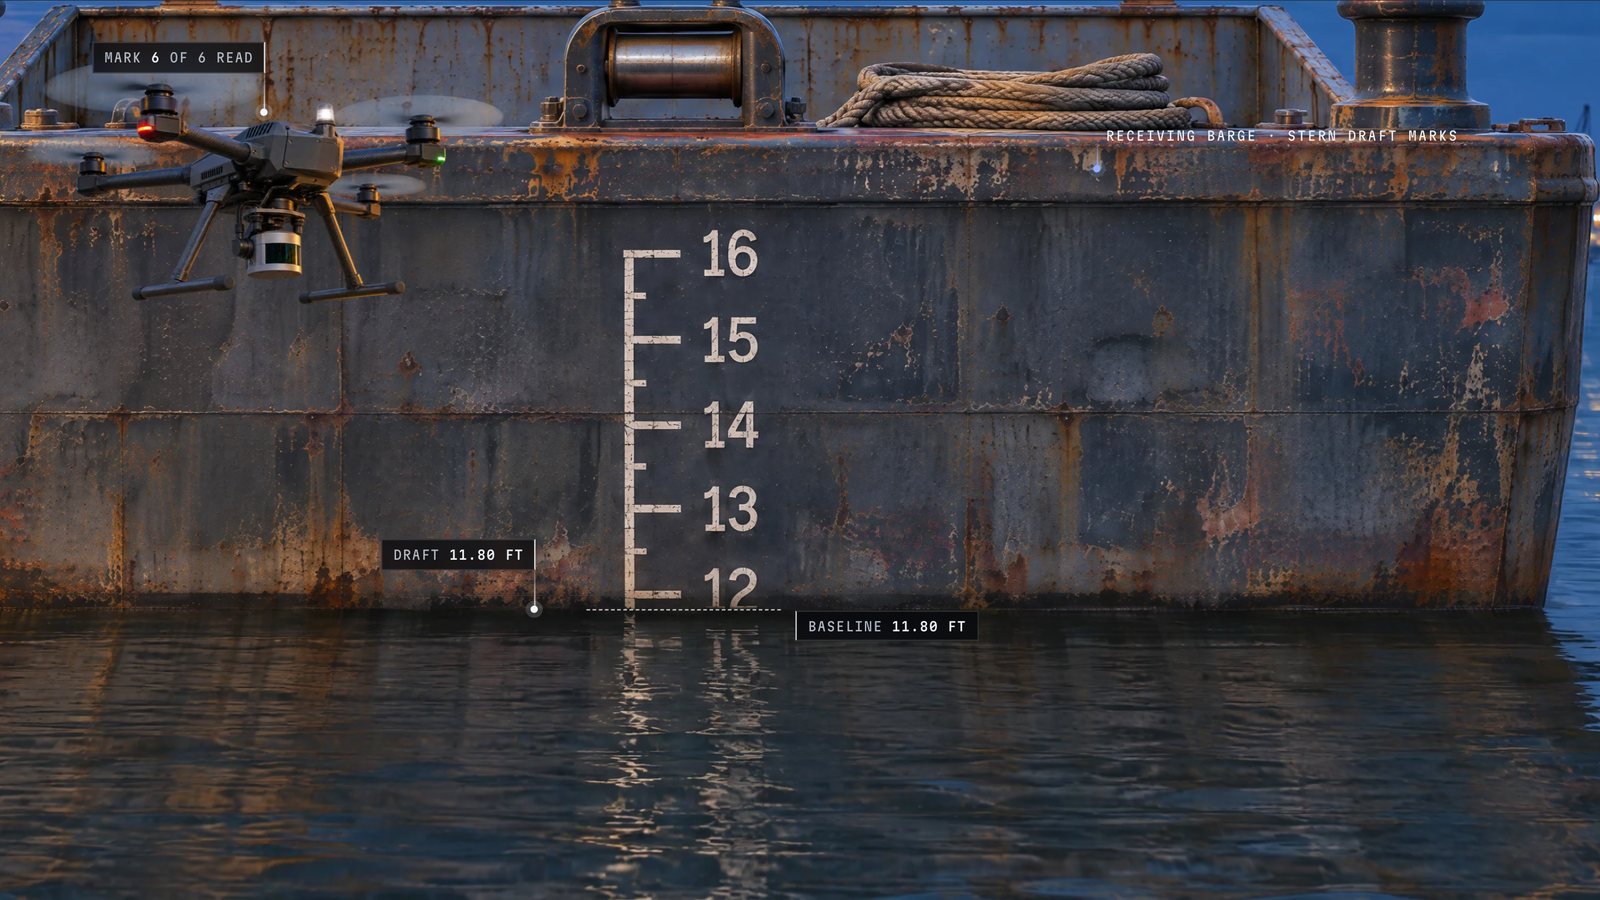
Before any cargo moves, the survey drone flies to six draft marks on the receiving barge: bow, middle and stern on each side. Each reading is recorded with its place and time. Together they are the baseline that every later change is measured from.

Illustrative checks01

  • Vessel reference
  • Six mark readings
  • Units and time

Loading plan0 / 12

  1. 1
  2. 2
  3. 3
  4. 4
  5. 5
  6. 6
  7. 7
  8. 8
  9. 9
  10. 10
  11. 11
  12. 12

Record for reviewBaseline surveyBeing preparedPrepared

Ready · Phase 01 of 06 · Pre-survey

What is measured
Six draft marks: bow, middle and stern on each side.
Illustrative checks
Vessel reference, six mark readings, units and time.
Record for review
Baseline survey

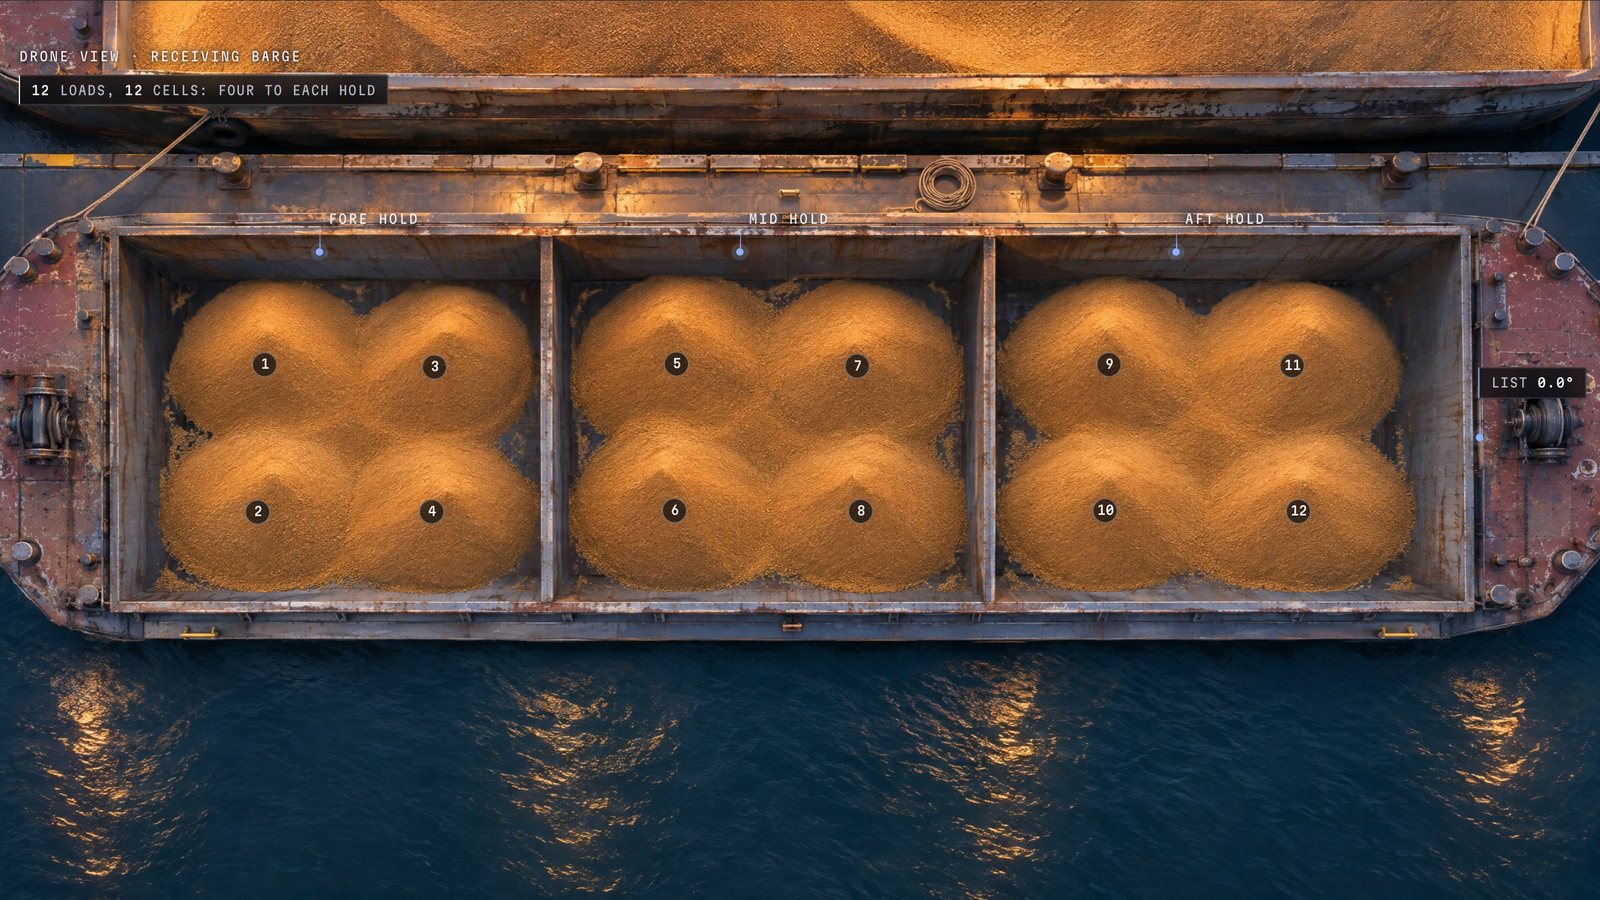
An illustrative scene. At the draft marks the barge settles by the configured amounts, against the scale painted on its hull. From above, each load goes to its own cell: three holds, four cells each. The readings are configured scenario values for the receiving barge.

Part two · the supply hub

Every pallet has its place.

Behind the quay, forklifts take pallets and totes from the receiving row to marked places in the supply hub. A pallet counts as stored only when the forks have let go and it rests in its place.

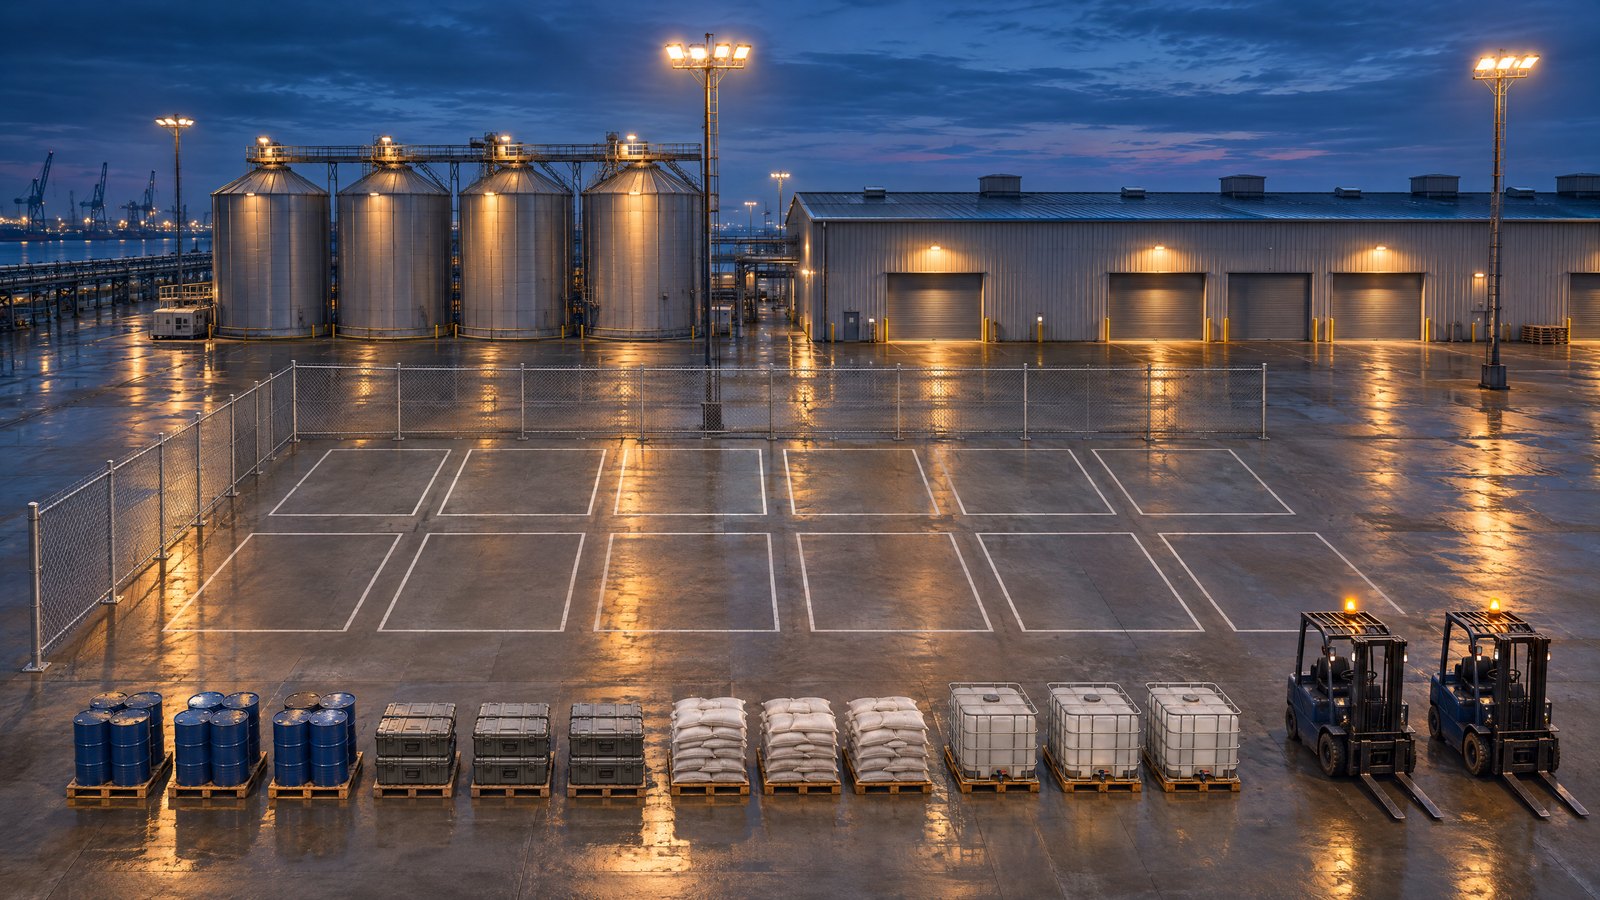
Illustration: a supply yard at blue hour. Twelve loaded pallets stand in a row in the foreground, and twelve painted storage places lie empty behind them. Two forklifts are parked at the right.
Resting in storage
0of 12
On the forks
0not counted
Deliveries
0this run
Illustration

PART 02 · STEP 1 / 3

Arrive

Twelve pallets wait in the receiving row.

Drums, equipment cases, sandbags and totes stand sorted by type. Twelve marked places are ready for them inside the hub. Nothing counts as stored yet.

PART 02 · STEP 2 / 3

Sort and stage

Each pallet goes to its own place.

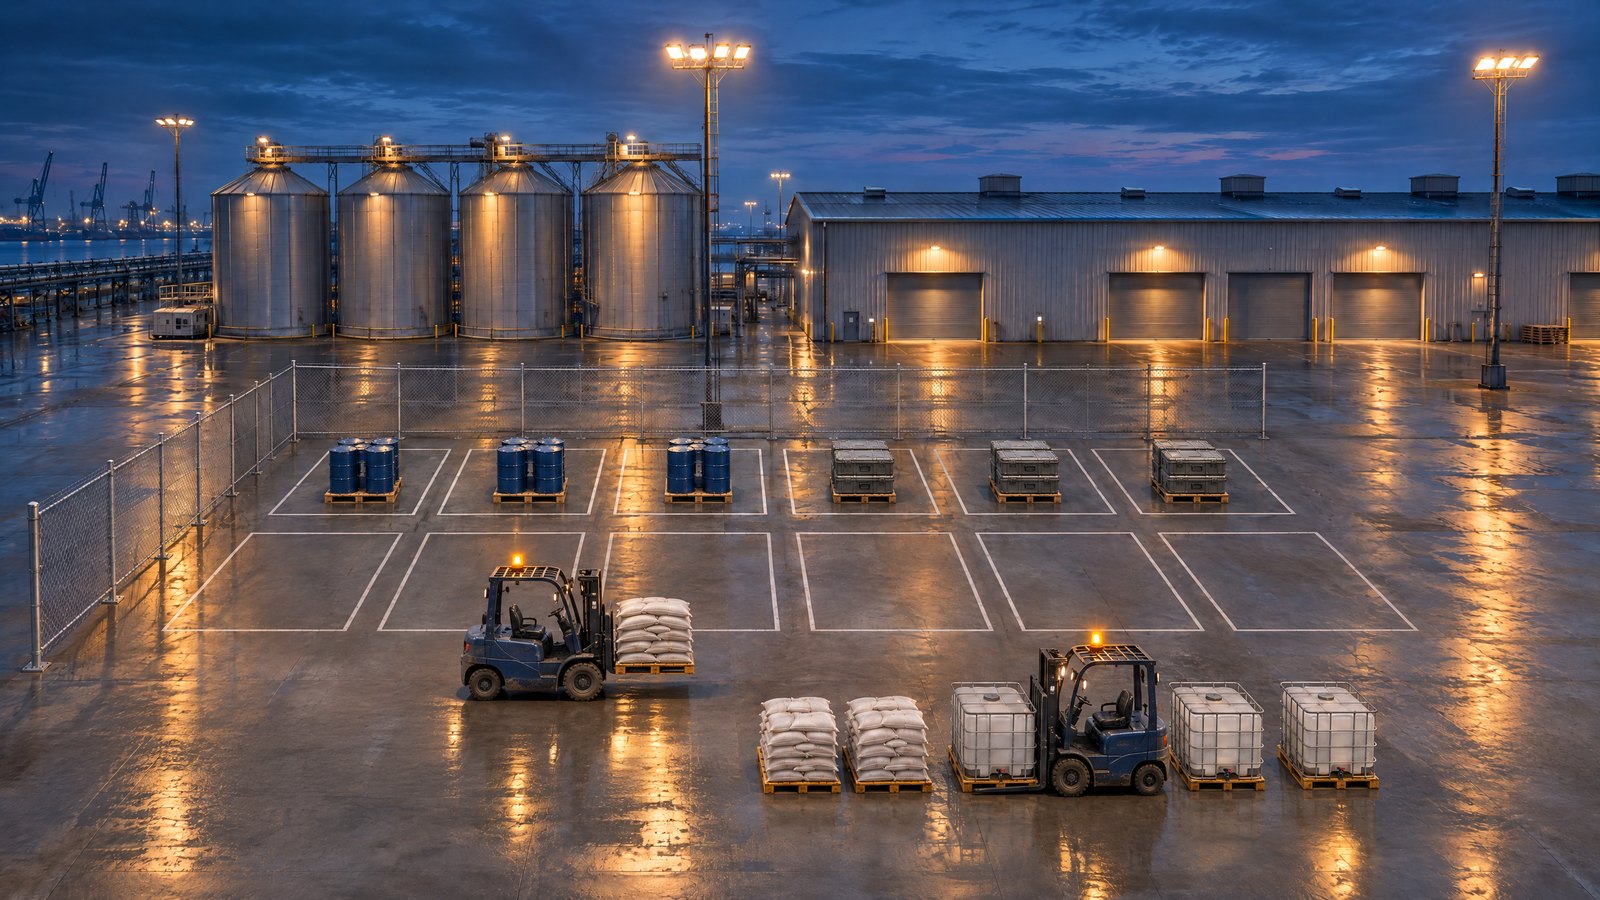
A forklift carries one pallet at a time and sets it down in its assigned place. A pallet on the forks is in transit: it is not counted until it rests. The drums and the cases are in; the sandbags are on their way.

PART 02 · STEP 3 / 3

Count

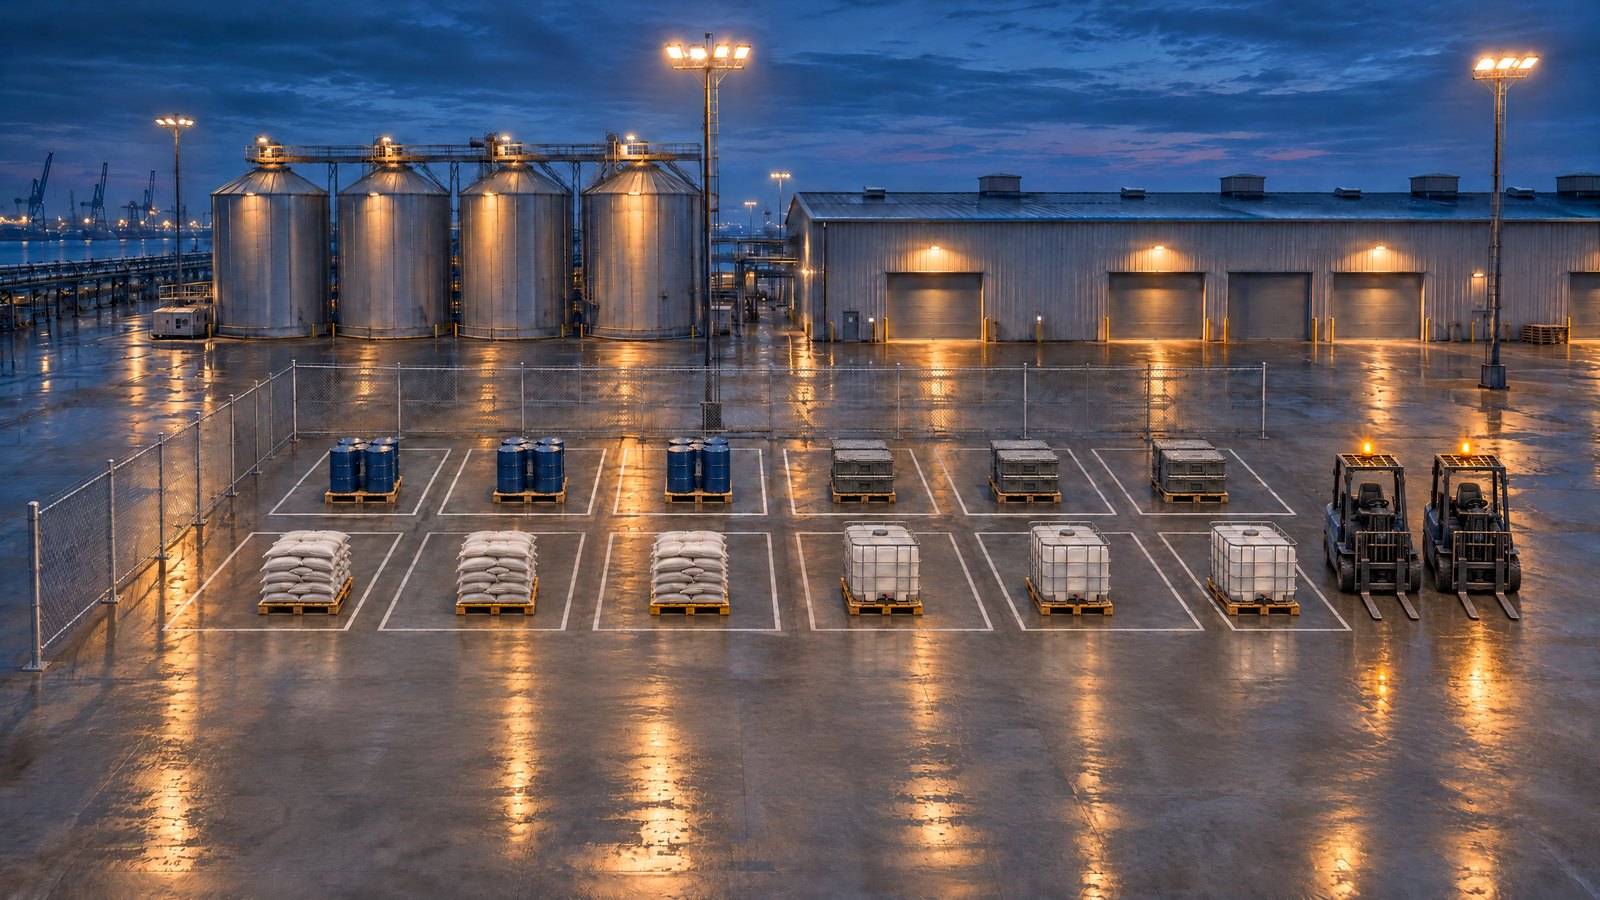
Twelve places, twelve pallets.

Every place holds its pallet and the receiving row is clear. The hub’s drone reads the yard, and the software keeps two numbers apart: what rests in storage now, and the deliveries made during the run.

Paused · Step 1 of 3 · Arrive

In the simulation the hub’s work repeats: eight forklifts each carry their pallets into the hub and back to their rows, and both counts are kept for as long as the run lasts. See the captures

Part three · the loading bay

Three loads a trailer, each counted once.

At the loading bay, eighteen-wheel trailers take the staged pallets and totes. A forklift drives up the ramp and sets each load in its own place, the first one deepest, then works back toward the doors.

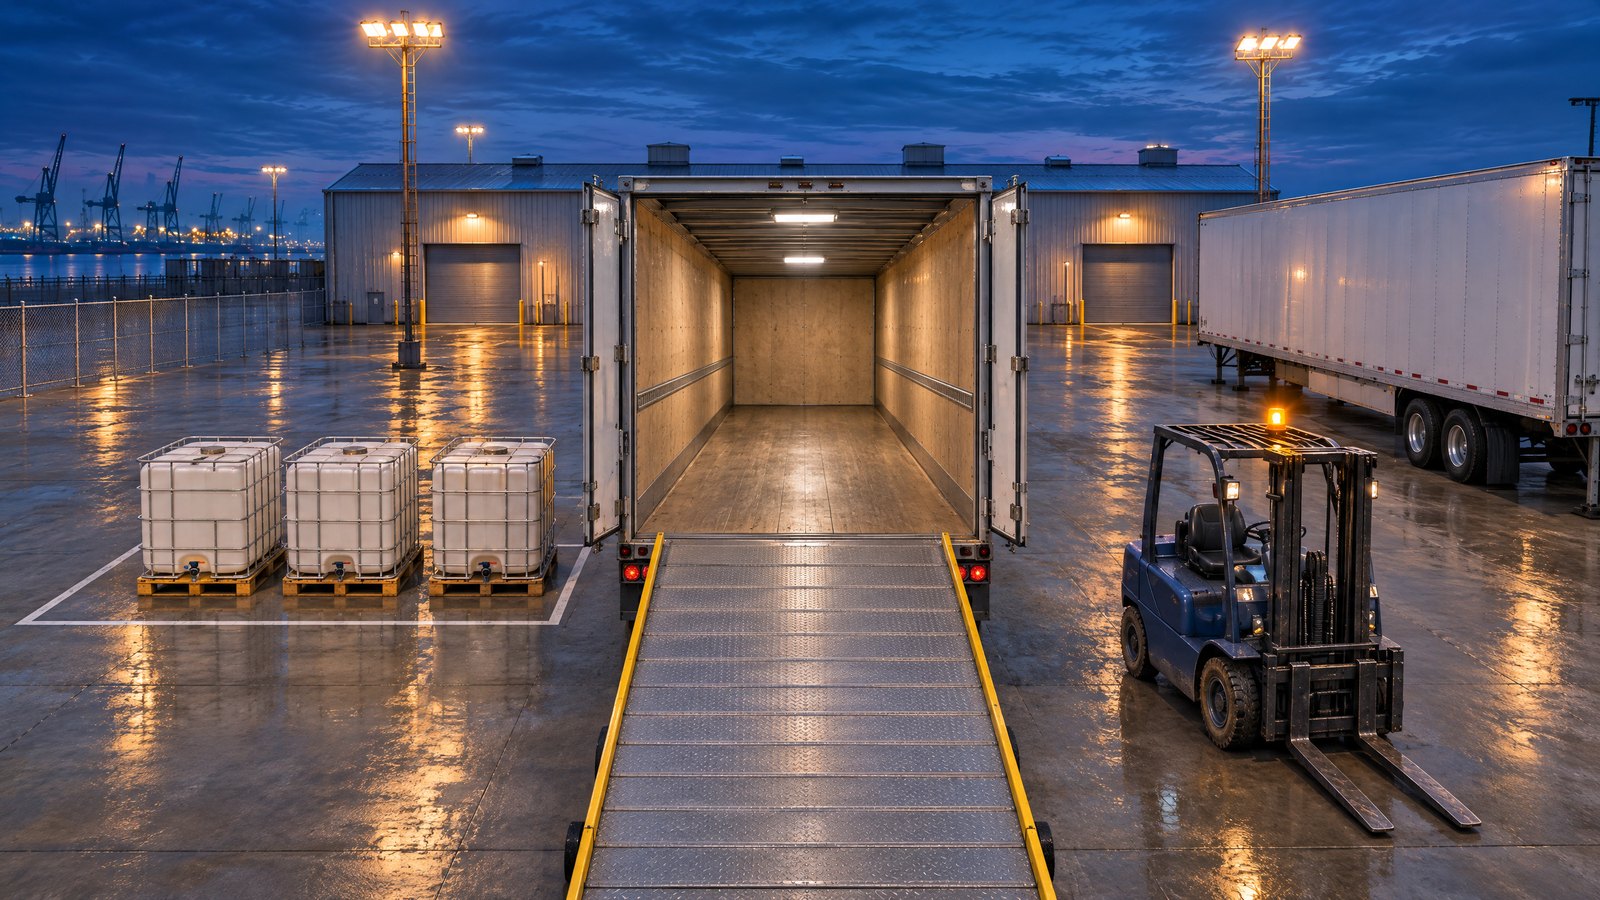
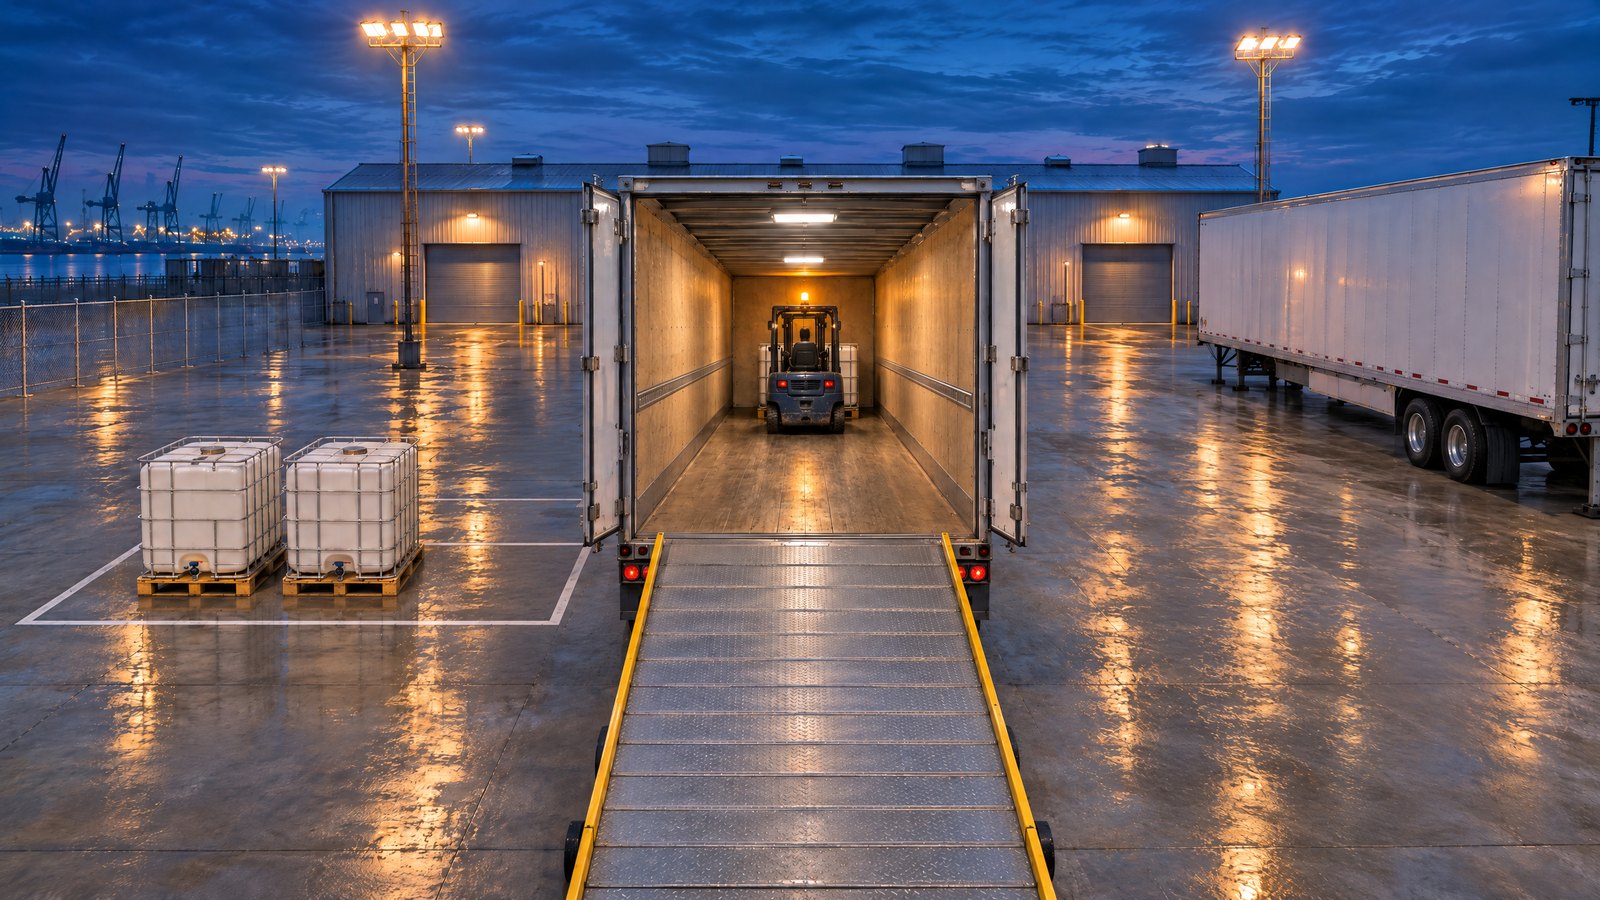
Illustration: a loading bay at blue hour. A white box trailer is seen from behind with its doors open and its lit interior empty. A steel ramp leads up into it. Three white totes wait in a painted bay and a forklift stands beside the ramp.
This trailer
0of 3 loads
Status
Open
Illustration

PART 03 · STEP 1 / 4

Ready

The trailer stands open at its ramp.

Its three totes are staged in the marked bay beside it and the forklift waits. Each trailer has its own kind of load: drums for one, equipment cases, sandbags and totes for the others.

PART 03 · STEP 2 / 4

First load, deepest

The first tote goes to the far end.

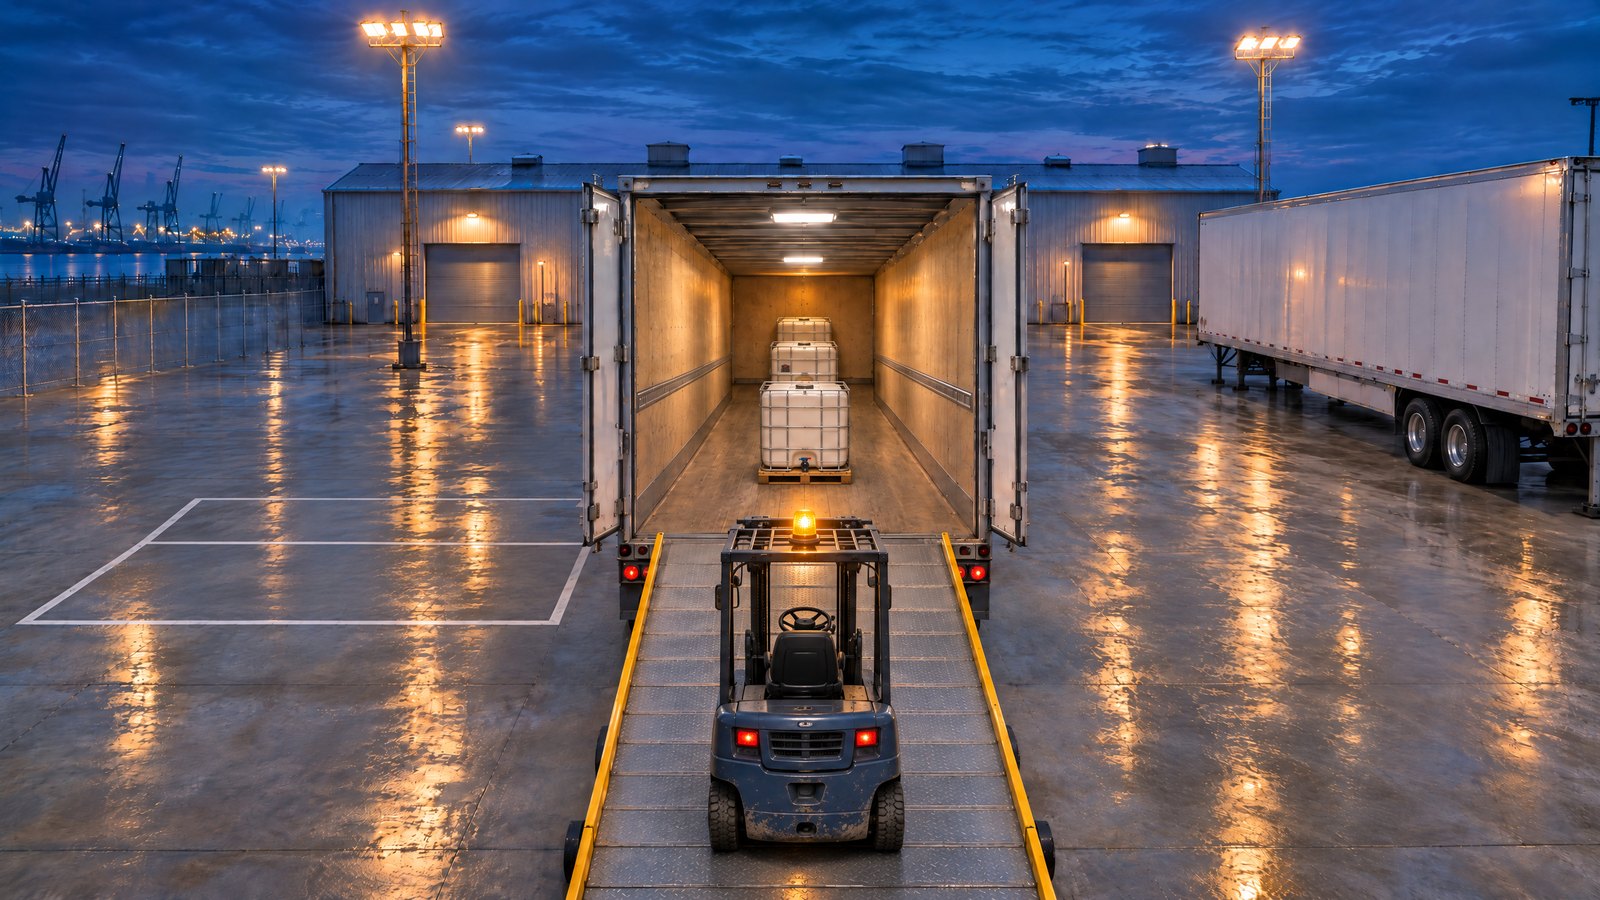
The forklift carries it up the ramp and sets it down against the end wall. The count waits: the load is placed, and it is counted once it rests and the forklift is clear.

PART 03 · STEP 3 / 4

Back toward the doors

The second and third go in front of the first.

Each load has its own place, and the earlier ones stay where they were set: nothing is pushed deeper to make room. With the forklift clear of the trailer, the count reads three of three.

PART 03 · STEP 4 / 4

Closed, ready to depart

Doors shut, and the trailer is counted ready.

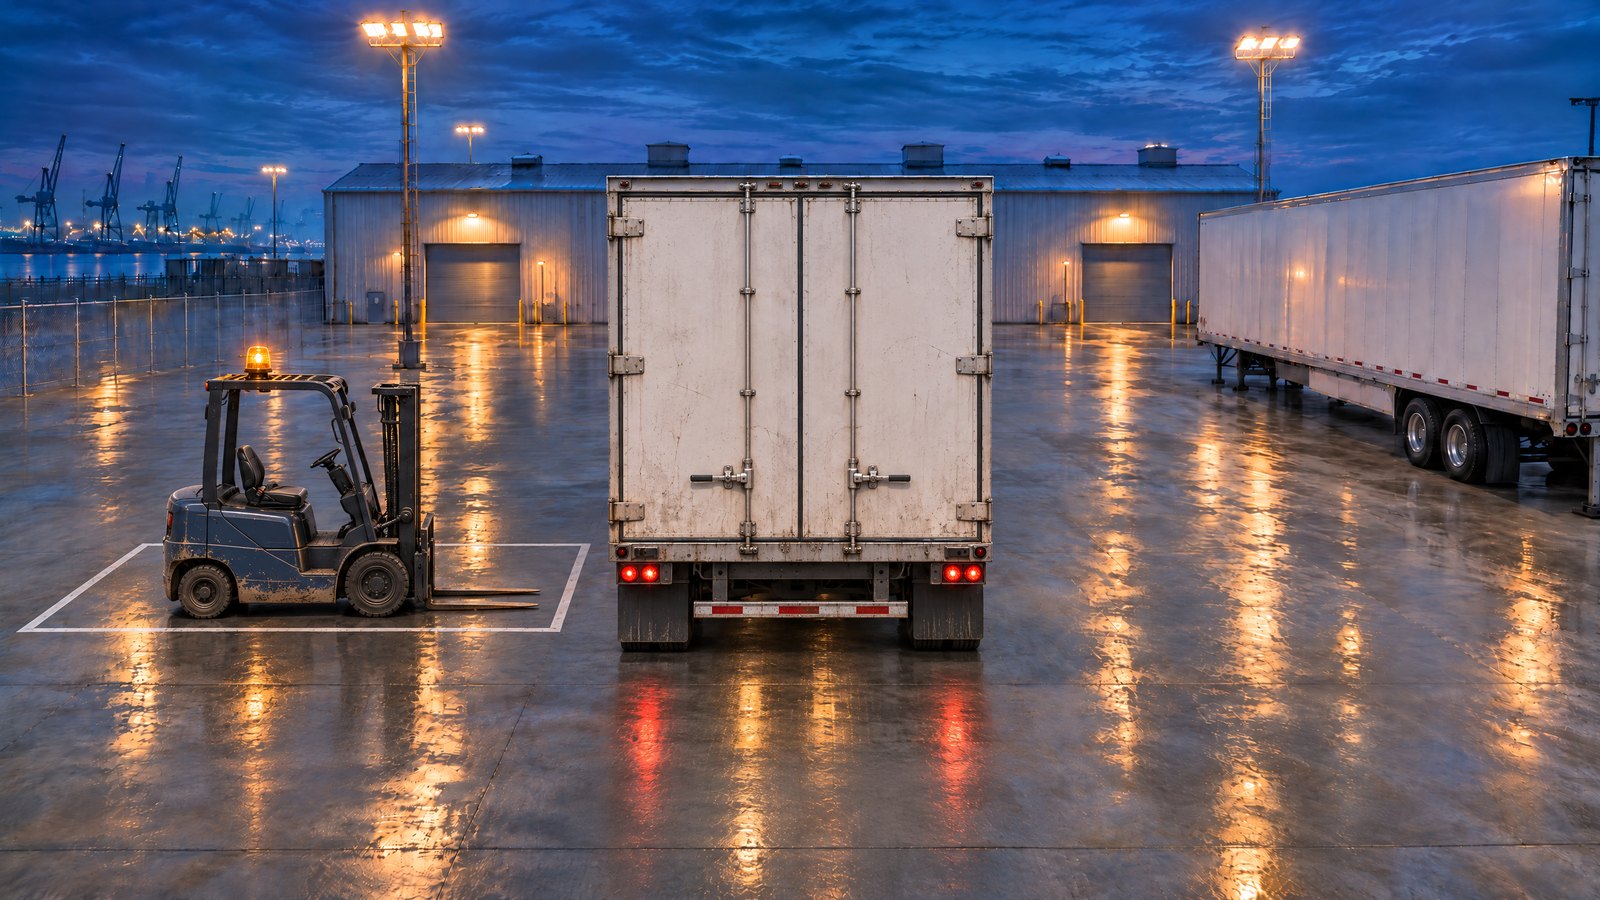
The doors are closed and latched and the ramp is clear. The bay’s drone reads the row of trailers, and the software records this one as ready to depart with its three loads.

Paused · Step 1 of 4 · Ready

In the simulation four trailers load at once, three pallets each: maintenance drums, survey equipment cases, sandbags and totes. See the captures

Around the three parts

The rest of the harbour keeps working.

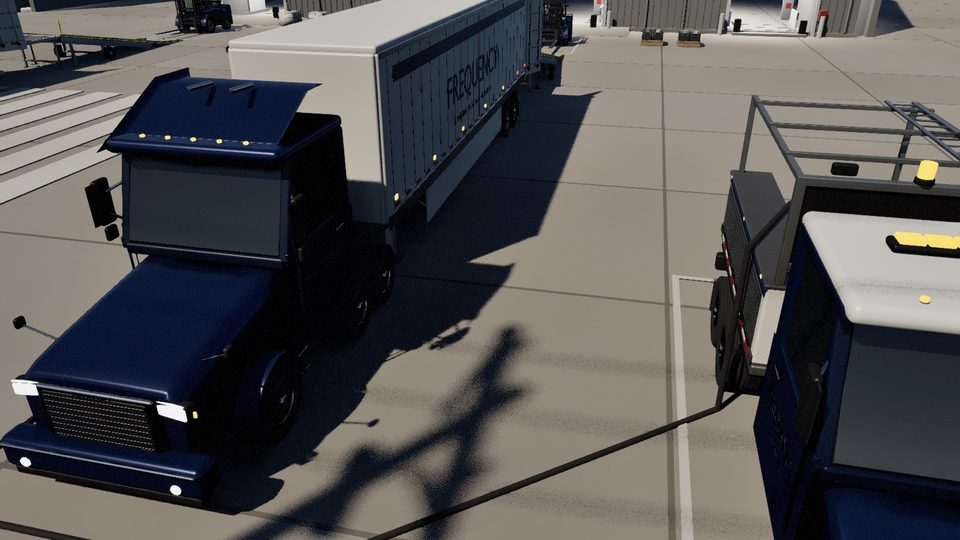
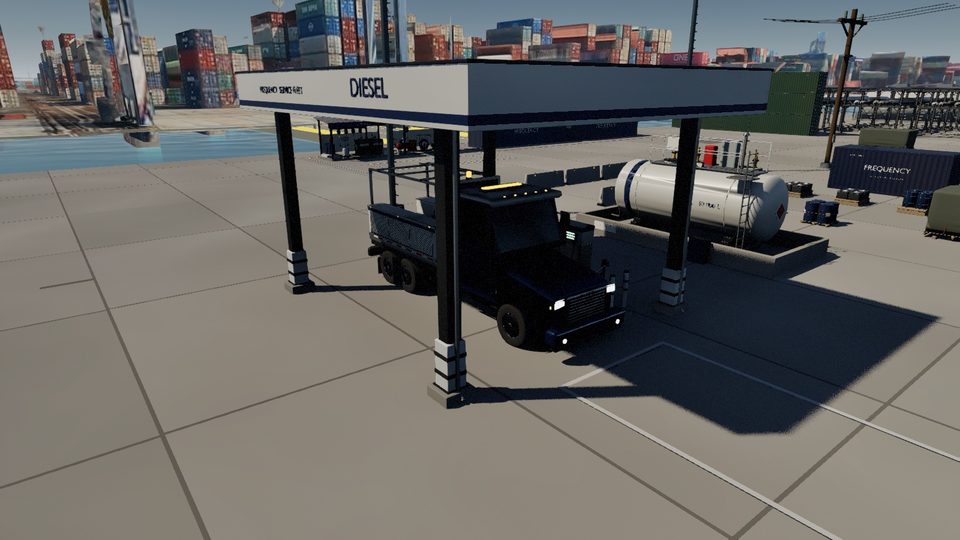
A harbour is more than a crane. In the simulation, fuel and service trucks, a tug and three survey drones work at the same time as the transfer, the hub and the bays.

Evidence · from the simulation

What the simulation showed.

The walkthroughs above are illustrations. These are not. On the evening of 10 November 2026 we started the Harbor simulation from an empty receiving barge and watched it through: the crane, the drones, the hub and the bays, all running together. The pictures are captures from that run, and the figures are the ones the survey software stored for it.

A computer simulation with its own physics, not a field operation. Run survey-20261111T044556-25C296BC.

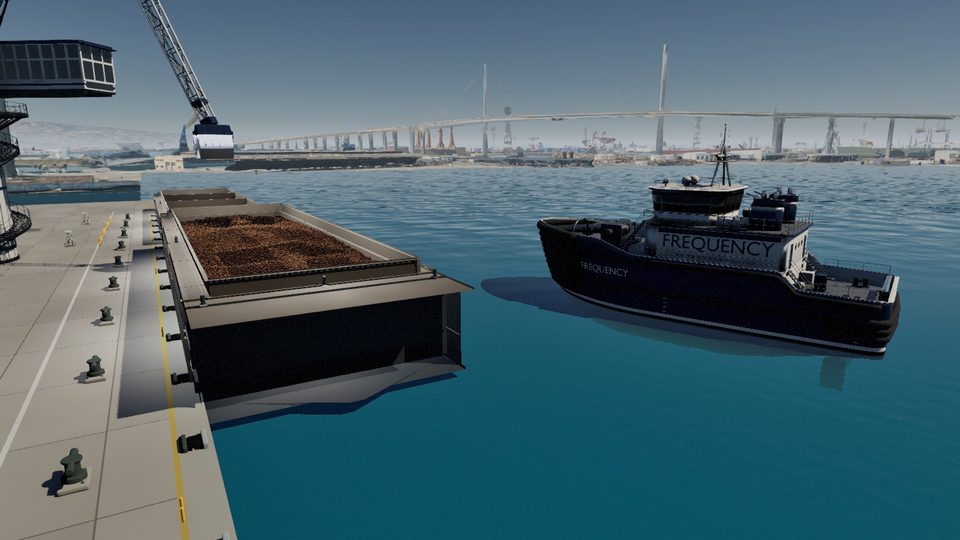
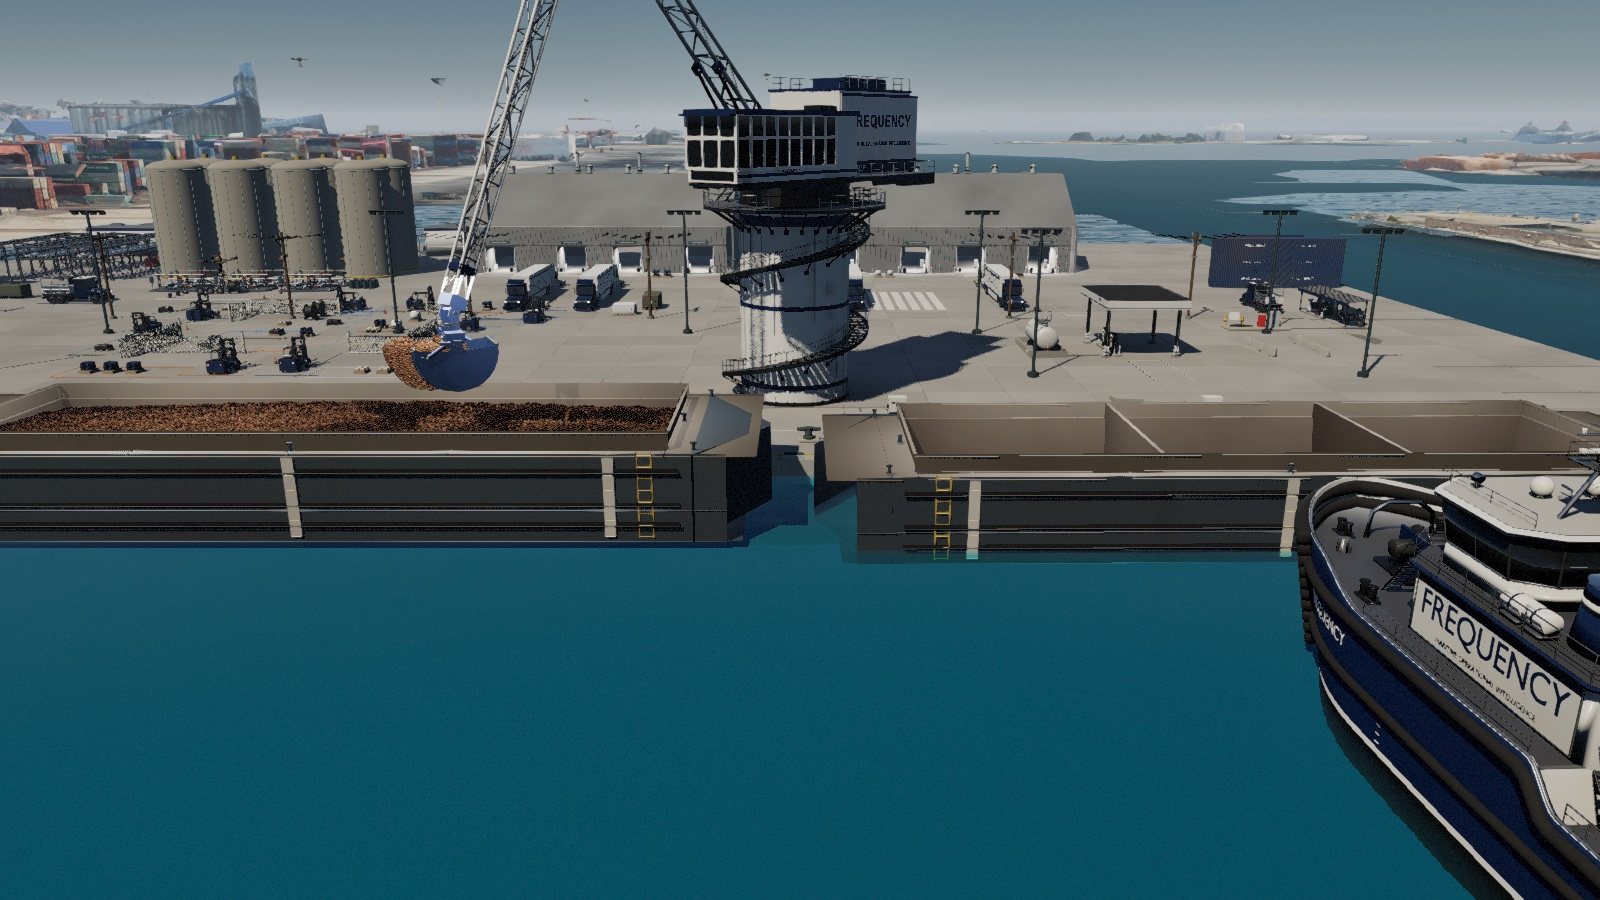
Simulation capture: a harbour crane swings a loaded grab between two barges moored at a quay, seen from over the water. A tug floats in the foreground.
Simulation capture · 05:14:37 UTCLoad 6 of 12 crossesThe crane carries a full grab from the source barge, on the left, to the receiving barge. The tug stands by in the foreground.
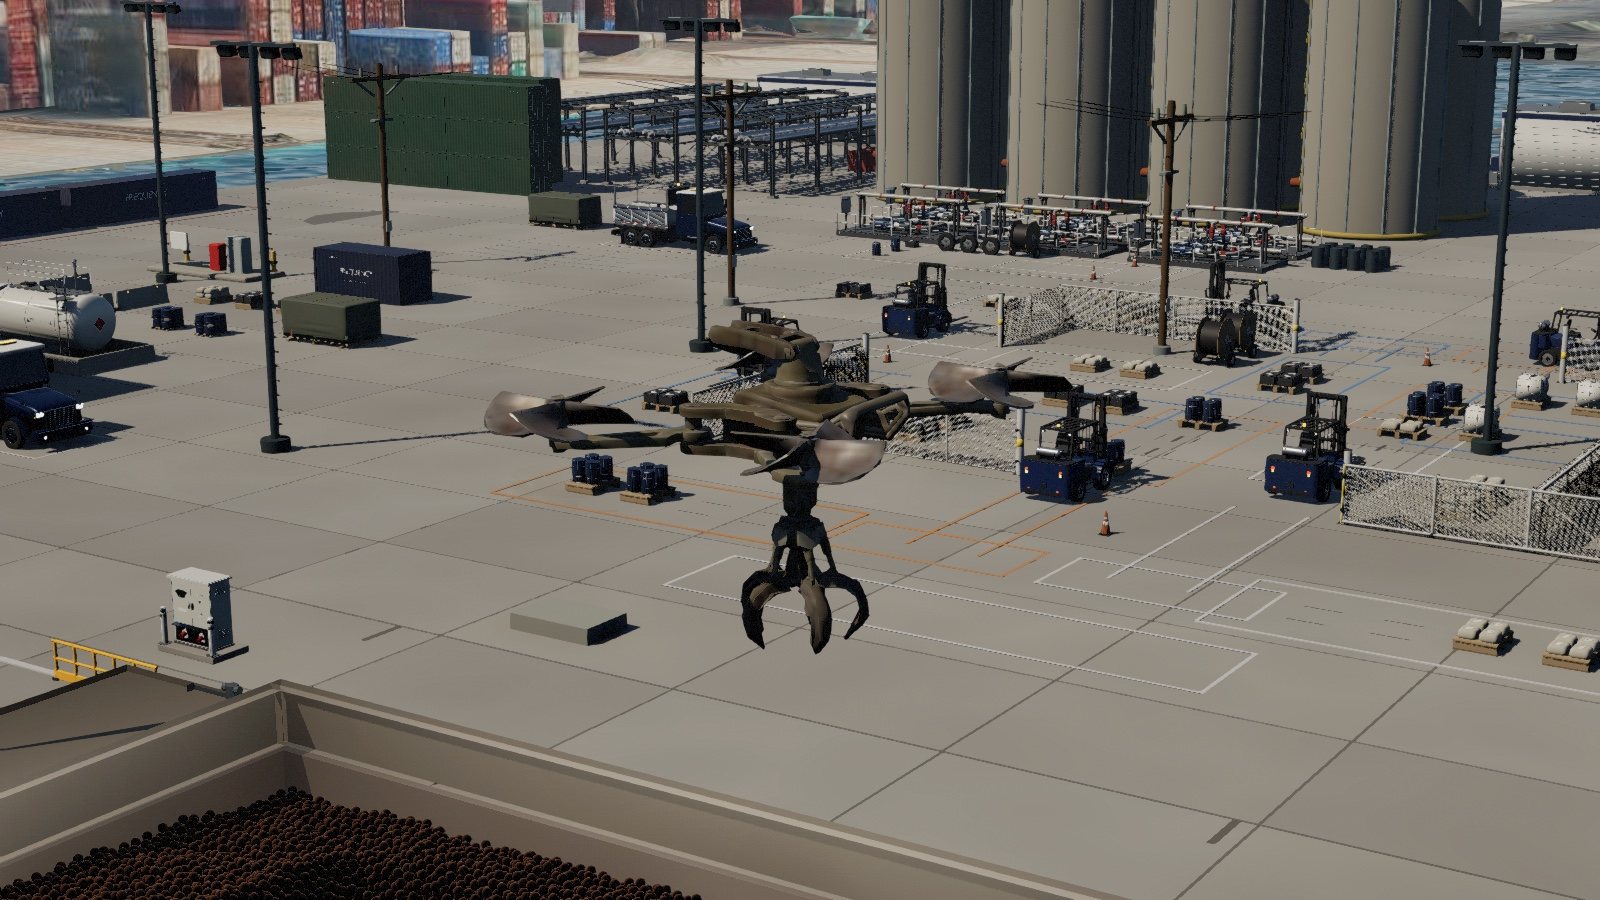
Simulation capture: a survey drone with a scanner under its body hovers above a barge. The supply hub with its forklifts is behind it.
Simulation capture · 05:32:53 UTCThe survey droneIt holds its place over the source barge and scans the pile before every load. Each scan in this run returned 352 points.
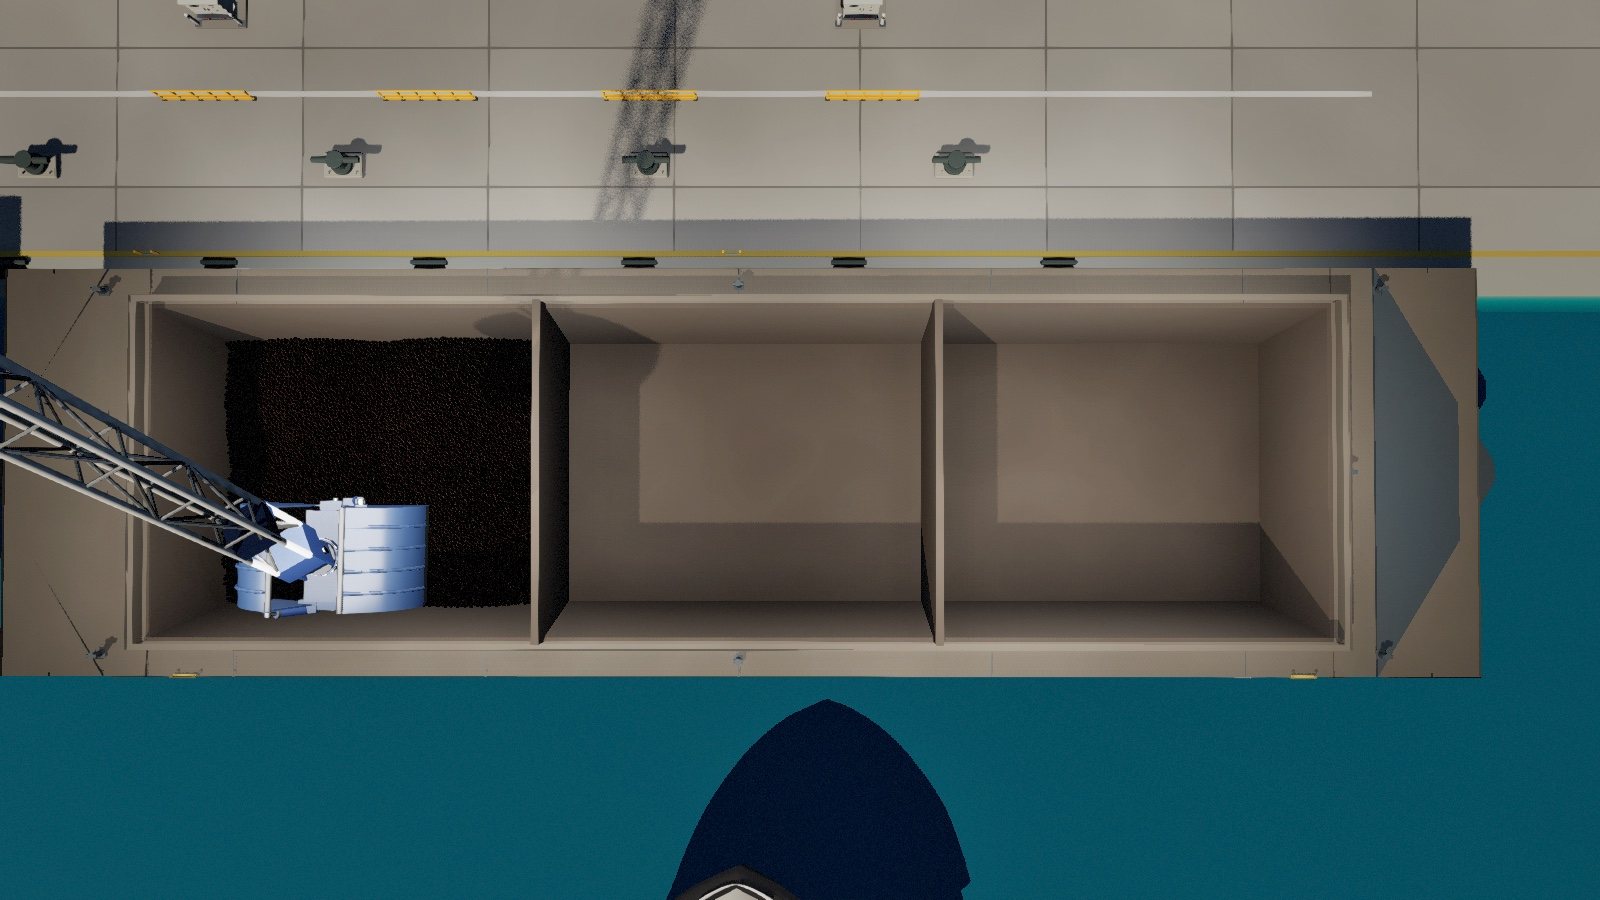
Simulation capture from directly above: a barge with three holds. The left hold has cargo across its floor; the other two are empty.
Simulation capture · 05:05:05 UTCAfter 4 loadsThe receiving barge from above. The first four loads are in the fore hold, at the left.
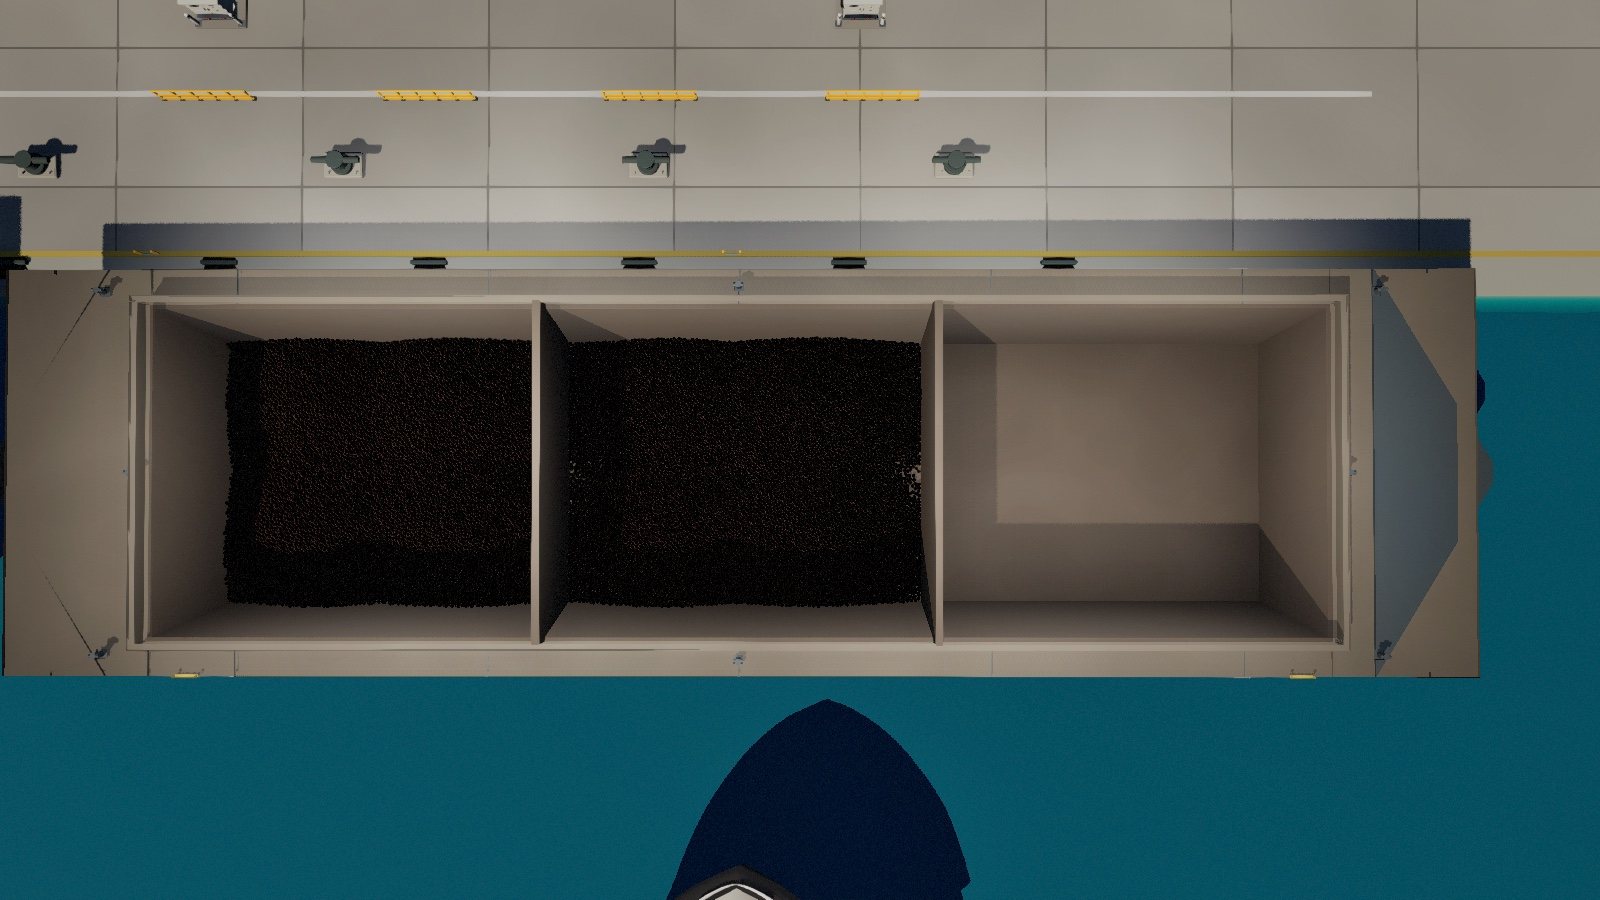
Simulation capture from directly above: the same barge with cargo in its left and middle holds.
Simulation capture · 05:23:38 UTCAfter 8 loadsFour more are in the mid hold. The crane works along the barge instead of heaping one hold.
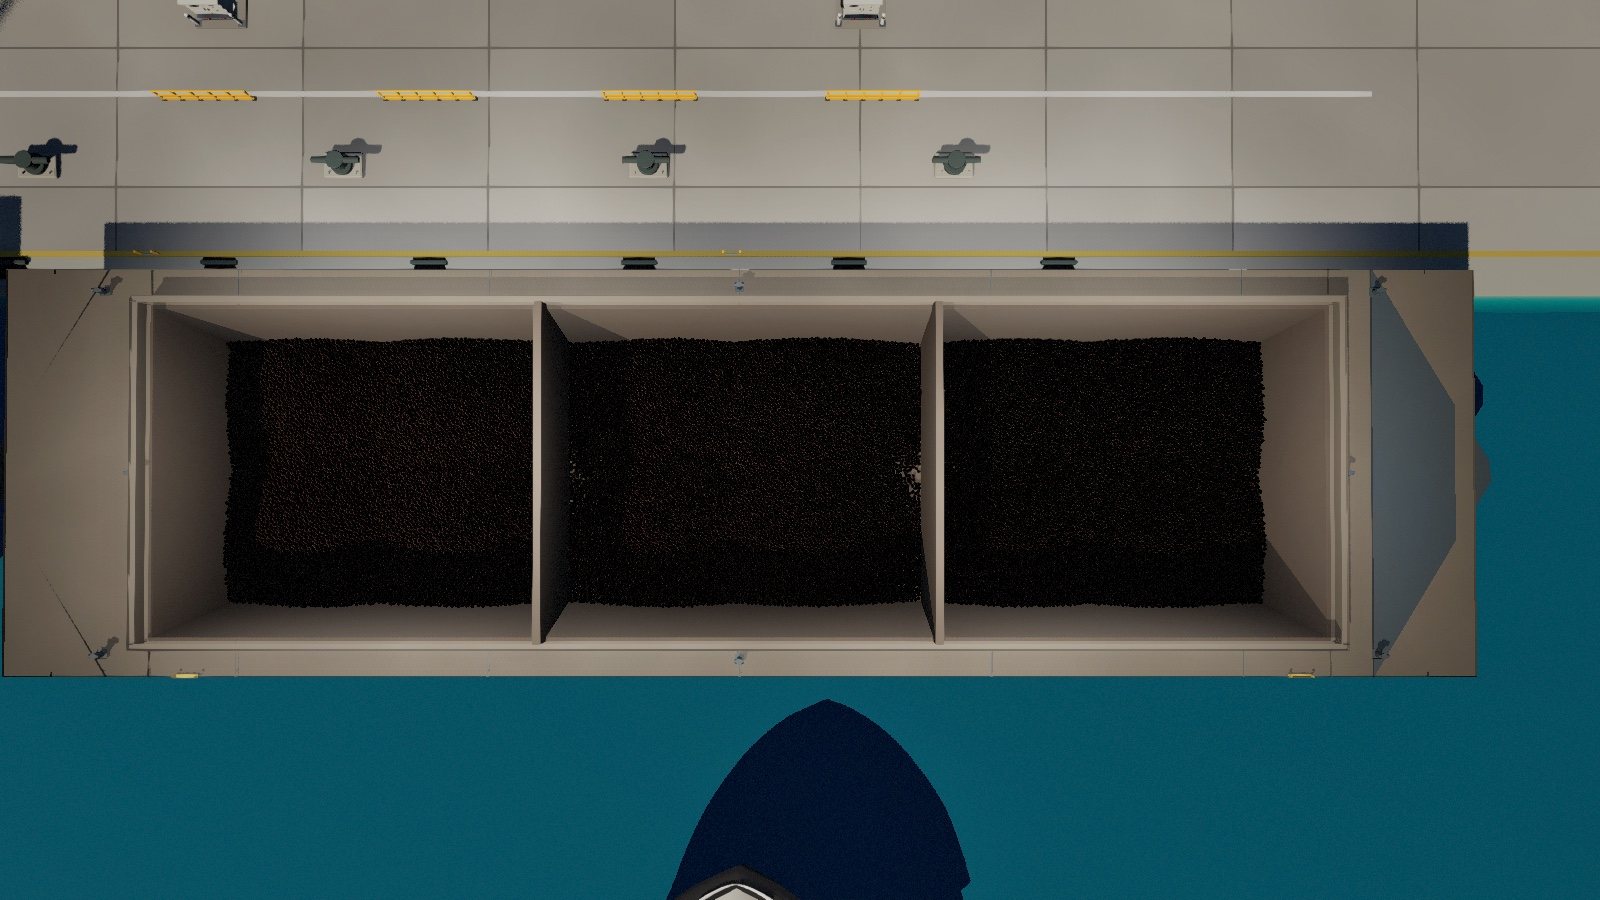
Simulation capture from directly above: the same barge with an even bed of cargo in all three holds.
Simulation capture · 05:37:02 UTCAfter 12 loadsFour loads in each hold. The barge ended with a list of 0.10° and a trim of 0.008 m.
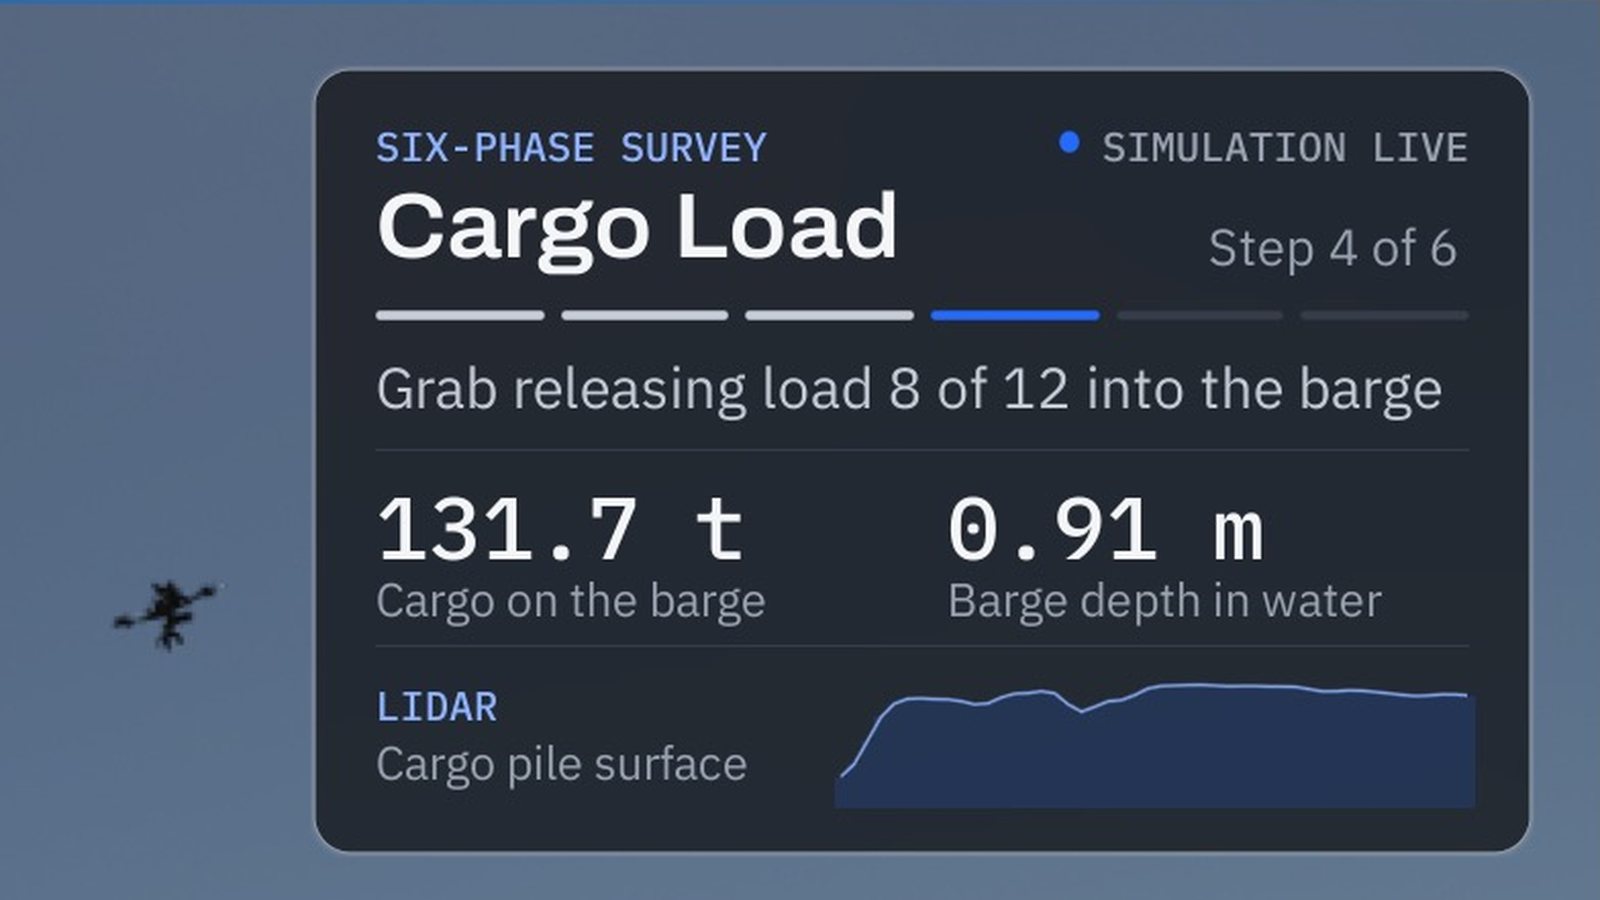
Simulation capture: an on-screen panel headed Six-phase survey, Cargo Load, step 4 of 6. Grab releasing load 8 of 12 into the barge. 131.7 t cargo on the barge, 0.91 m barge depth in water, and a LiDAR profile of the cargo pile. A drone is in the sky beside it.
Simulation capture · 05:22:46 UTCThe simulation’s own panel, during loadingThe simulation draws one small panel for the place in view. Here it follows the six-phase survey as the eighth load is released: 131.7 t aboard, 0.91 m deep.
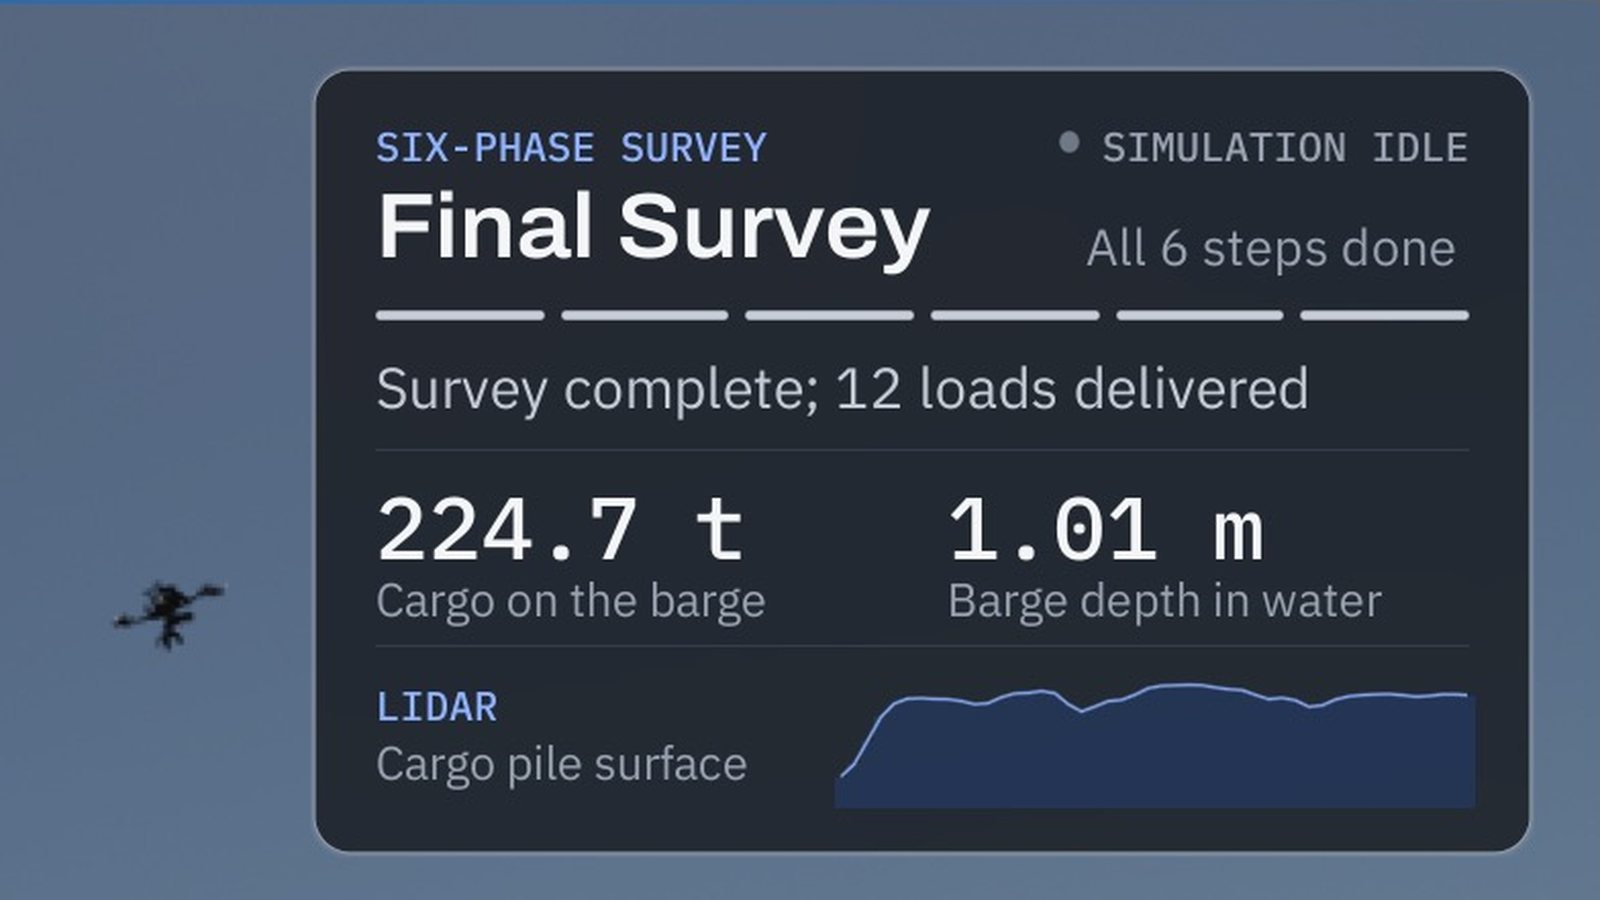
Simulation capture: the same panel reading Final Survey, all 6 steps done, survey complete, 12 loads delivered, 224.7 t cargo on the barge, 1.01 m barge depth in water.
Simulation capture · 05:47:23 UTCThe same panel at the endFinal Survey, all six steps done: 12 loads delivered, 224.7 t on the barge, 1.01 m deep in the water.
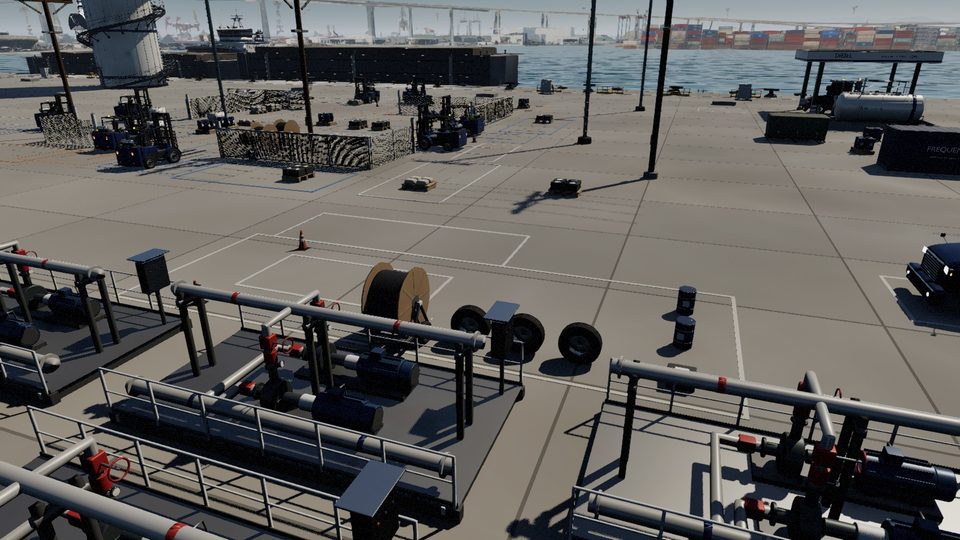
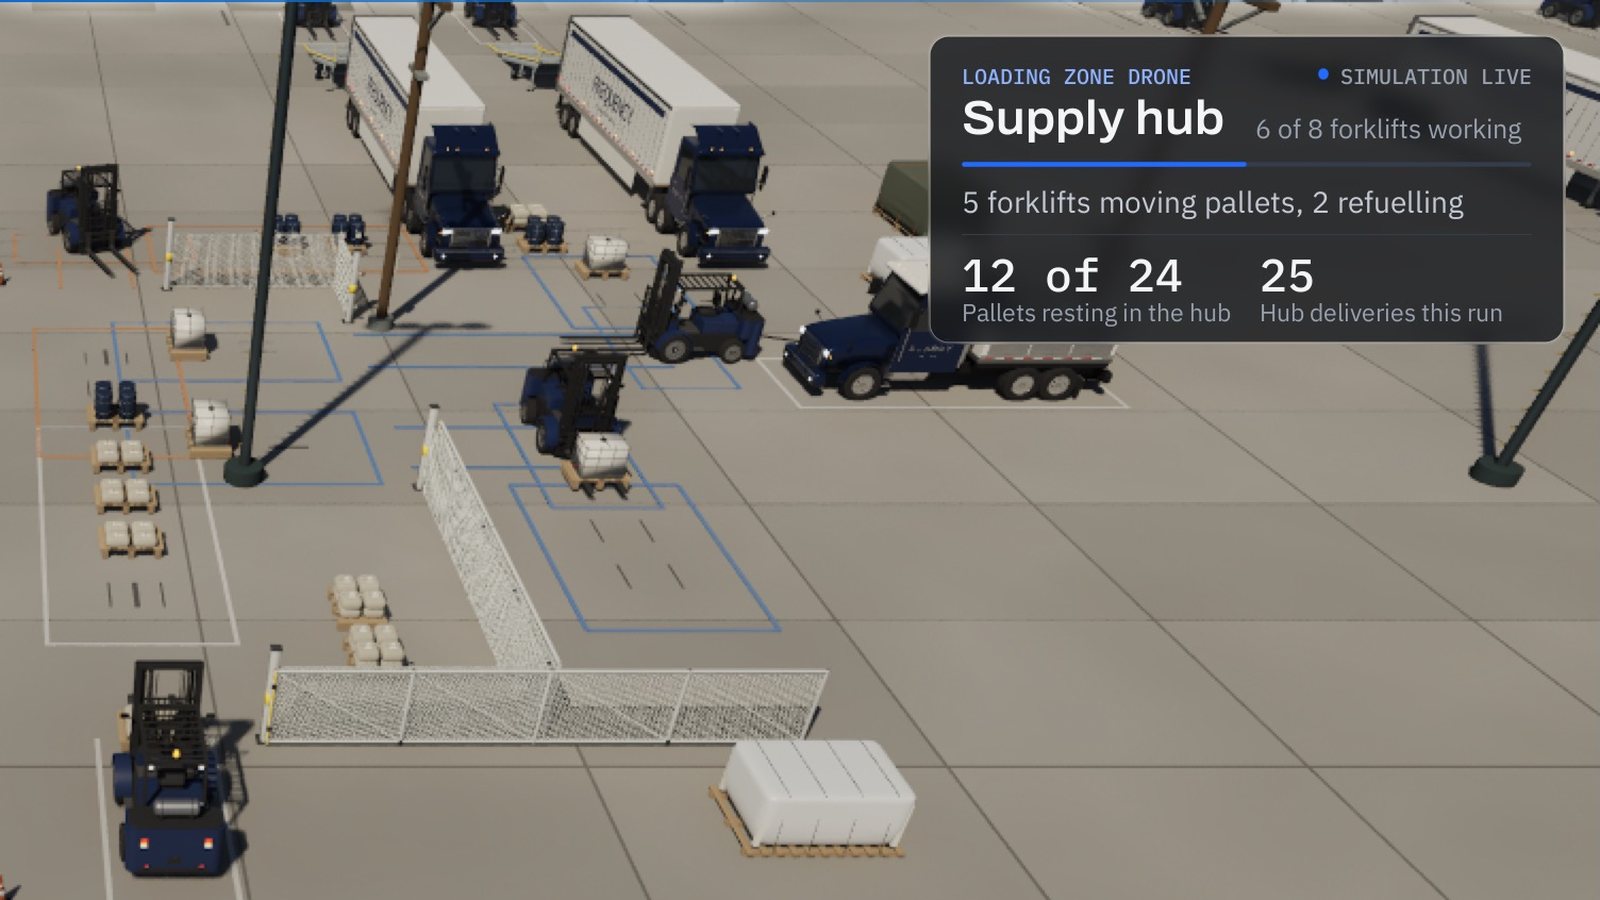
Simulation capture: forklifts and pallets in a marked yard, with a panel headed Supply hub: 6 of 8 forklifts working, 12 of 24 pallets resting in the hub, 25 hub deliveries this run.
Simulation capture · 05:47:03 UTCThe supply hub’s panelForklifts carry pallets into the hub and back to their rows. At this moment 12 of 24 pallets rested in the hub, after 25 deliveries.
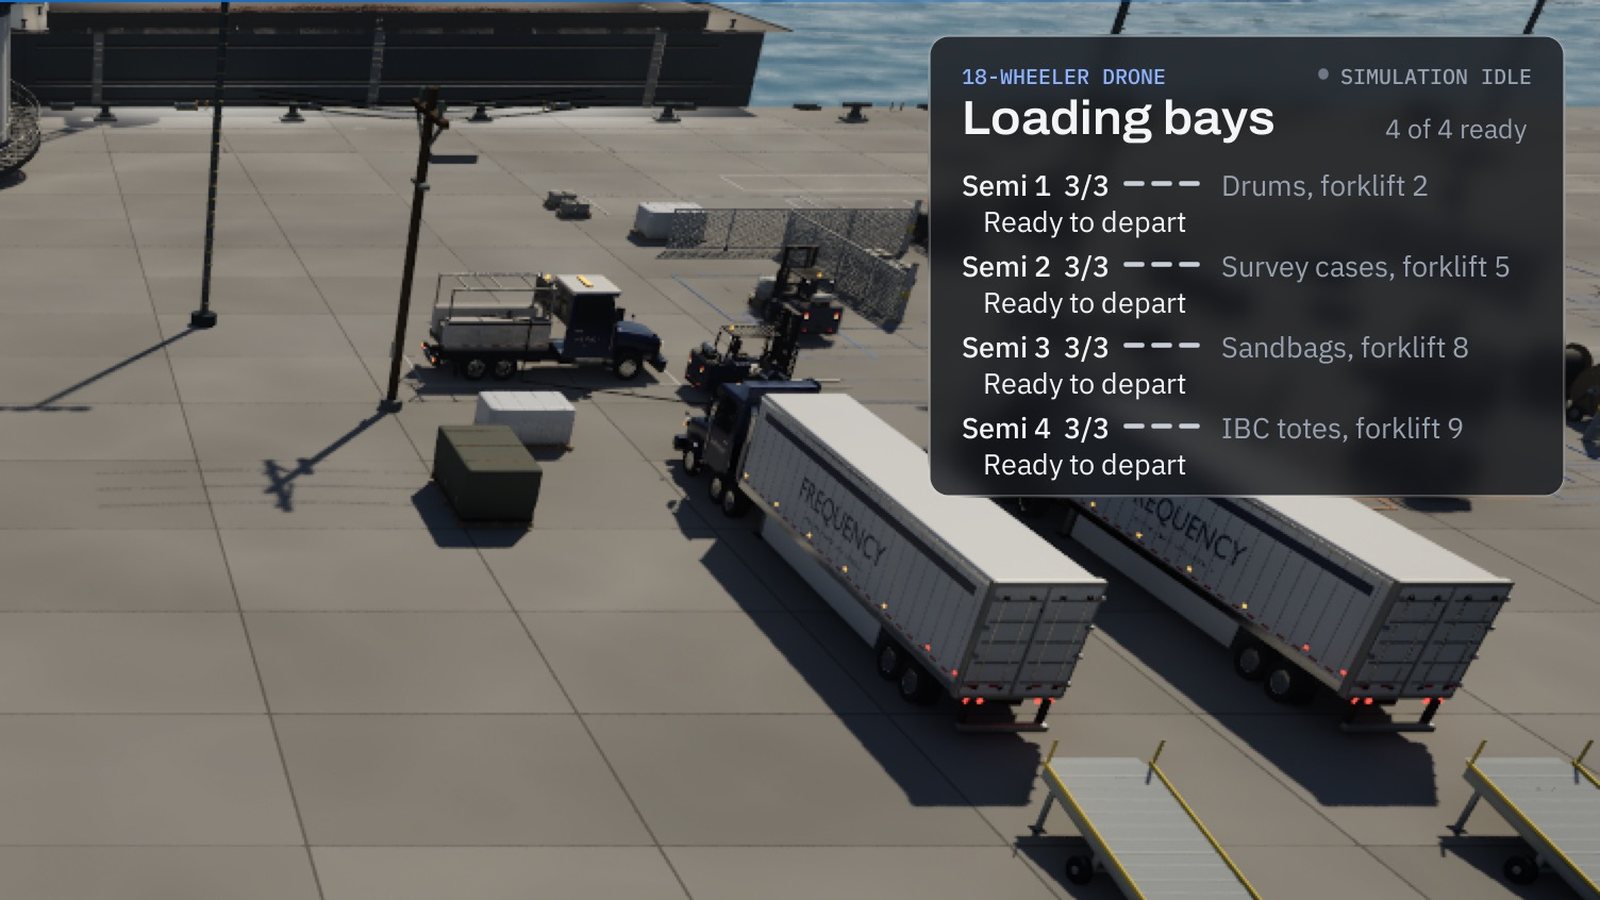
Simulation capture: white semi-trailers at the loading bays, with a panel headed Loading bays, 4 of 4 ready, listing Semi 1 to Semi 4 at 3 of 3 loads, each ready to depart.
Simulation capture · 05:47:13 UTCThe loading bays’ panelFour trailers, three loads each: drums, survey cases, sandbags and IBC totes. All four read ready to depart.
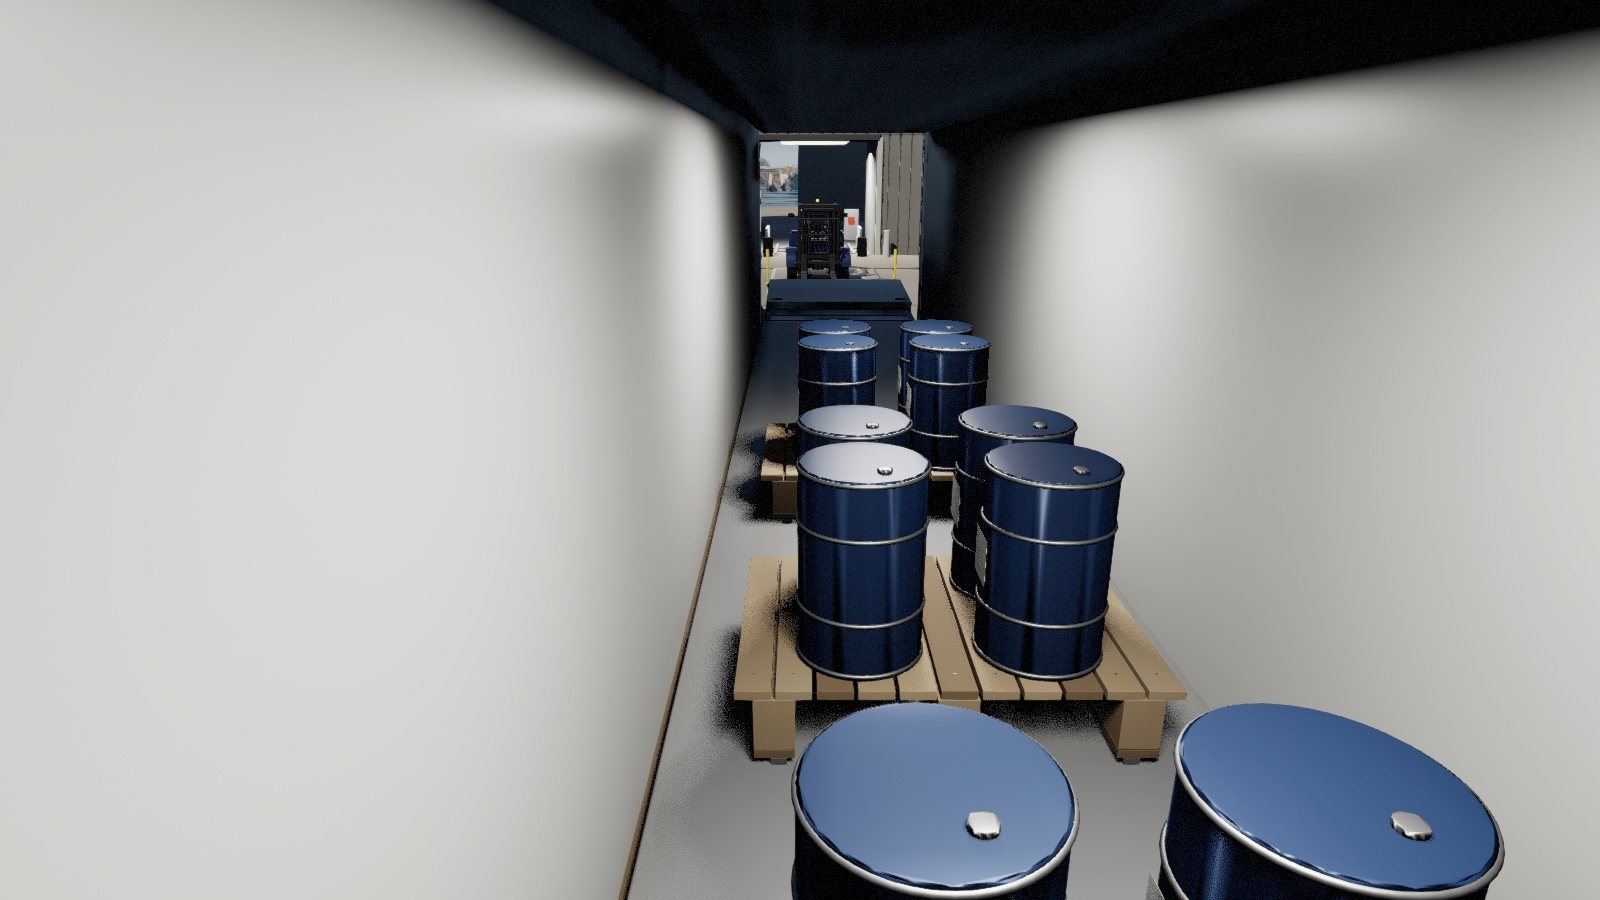
Simulation capture: the inside of a box trailer with three pallets of blue drums standing in a line toward the open doors.
Simulation capture · 05:46:16 UTCInside Semi 1Three pallets of drums, each on its own place along the floor, seen from the cab end. The first was set deepest.
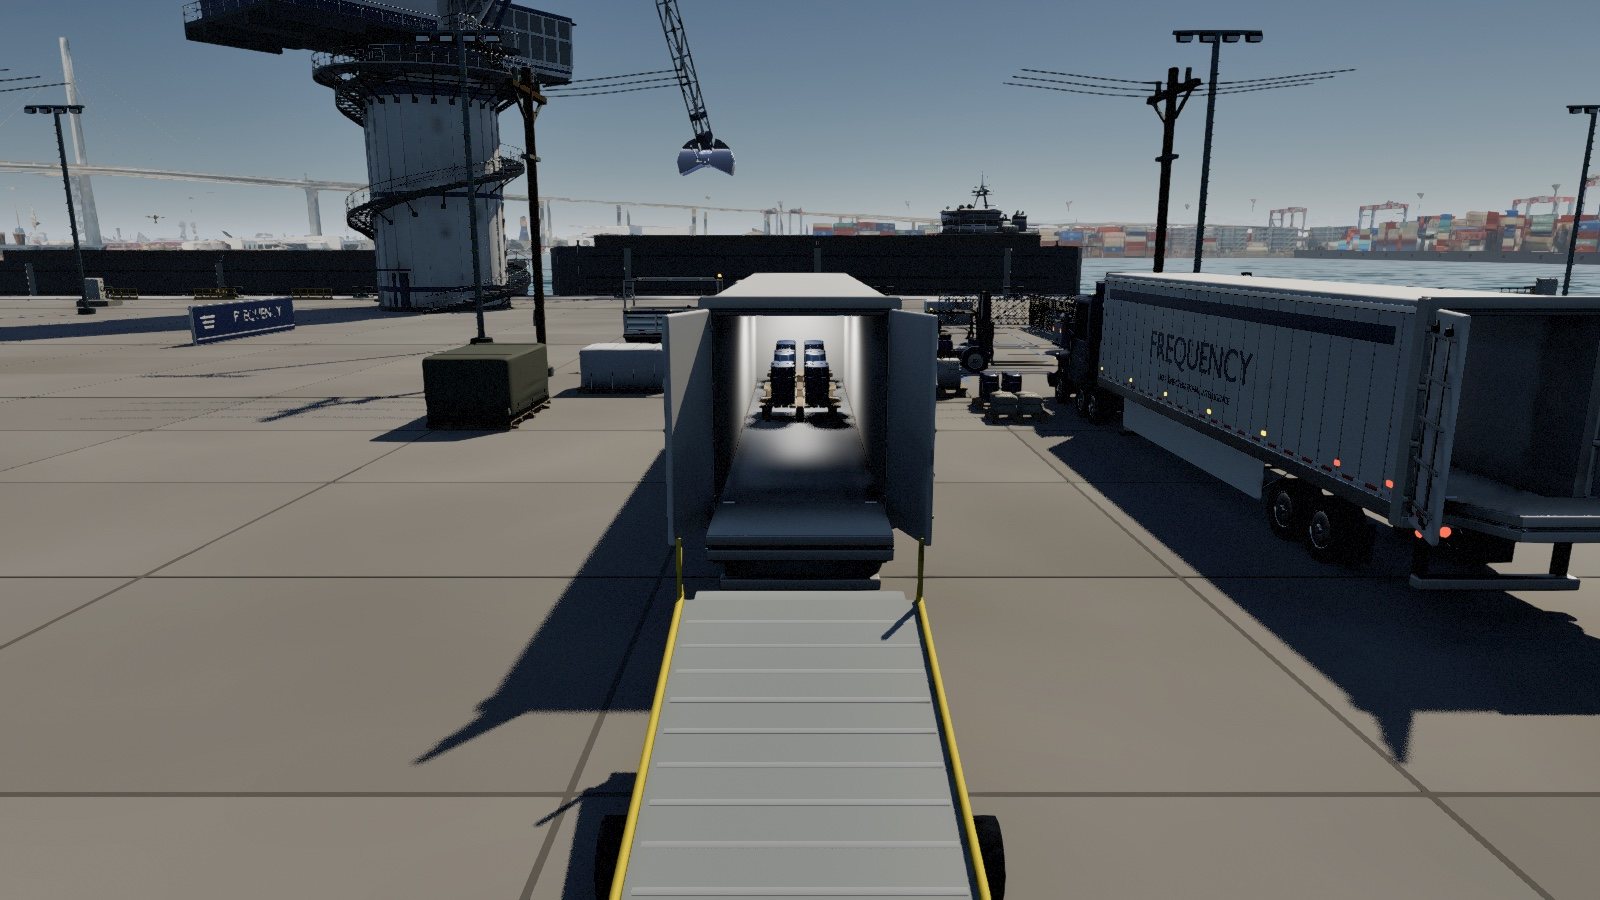
Simulation capture: a steel ramp leading up into the open back of a white trailer, with pallets inside and the crane beyond.
Simulation capture · 05:46:14 UTCThe ramp and the open doorsEach forklift drove up its ramp, set its load down and backed out before the load was counted.

The run on record

survey-20261111T044556-25C296BC

Crane loads
12 of 12each with its six steps recorded: 72 step records
Six survey phases
Completefirst reading 04:46:17 UTC, final survey complete 05:38:23 UTC
Barge depth in water
0.76 m → 1.01 mmean of six draft stations, before and after
Cargo, from the drafts
224.69 tchange in displacement, less the change in ballast (0 t)
Cargo the crane delivered
224.68 tthe simulation’s own count: a difference of 0.7 kg
Barge at the end
List 0.10° · trim 0.008 mtwelve loads in twelve cells left it level
Trailers · simulation log
4 of 4 readythree loads each, counted once: drums, survey cases, sandbags and IBC totes; all closed and ready at 05:46 UTC
Supply hub · simulation panel
12 of 24 resting25 deliveries by 05:47 UTC, with the forklifts still at work
  1. Pre-surveycomplete 04:47:34
  2. Ballastcomplete 04:48:01
  3. Cranecomplete 04:48:22
  4. Cargocomplete 05:37:15
  5. Trimcomplete 05:37:23
  6. Final surveycomplete 05:38:23

The first six figures are what the survey software stored for the run. The trailer and hub counts come from the simulation’s own log and panels.

What this shows, and what it does not. The two cargo figures agree because the survey calculation is consistent with the simulation’s own physics: a check of the software against the simulation. It is not a field measurement, an accuracy claim at sea or a measure of time saved.

Times are UTC, from the run’s records. The run began at 04:45 UTC on 11 November (10:45 pm US Central on 10 November), shared its computer with other work and ran slowly, so the times say nothing about speed. The words “Simulation live” on a panel mean the run was in progress when that picture was taken; every picture here is a still. The simulation’s cargo is dark; the illustrated walkthrough shows grain.

Optional · before the transfer

From a reading to a result for review.

  1. 01 · UnderstandEstablish the source and context.
  2. 02 · CheckMake the open questions visible.
  3. 03 · ReviewPrepare the result for review.

Three steps · about ten seconds

Read the written transcript

Part one: the survey, phase by phase.

01Pre-survey

Record where the vessel starts.

What happens
Before any cargo moves, the survey drone flies to six draft marks on the receiving barge: bow, middle and stern on each side. Each reading is recorded with its place and time. Together they are the baseline that every later change is measured from.
Illustrative checks
Vessel reference, six mark readings, units and time.
Record for review
Baseline survey

Configured values at the end of the phase: mean draft 11.80 ft, 0 of 12 loads aboard, trim 0.00 ft.

02Ballast adjustment

Keep ballast apart from cargo.

What happens
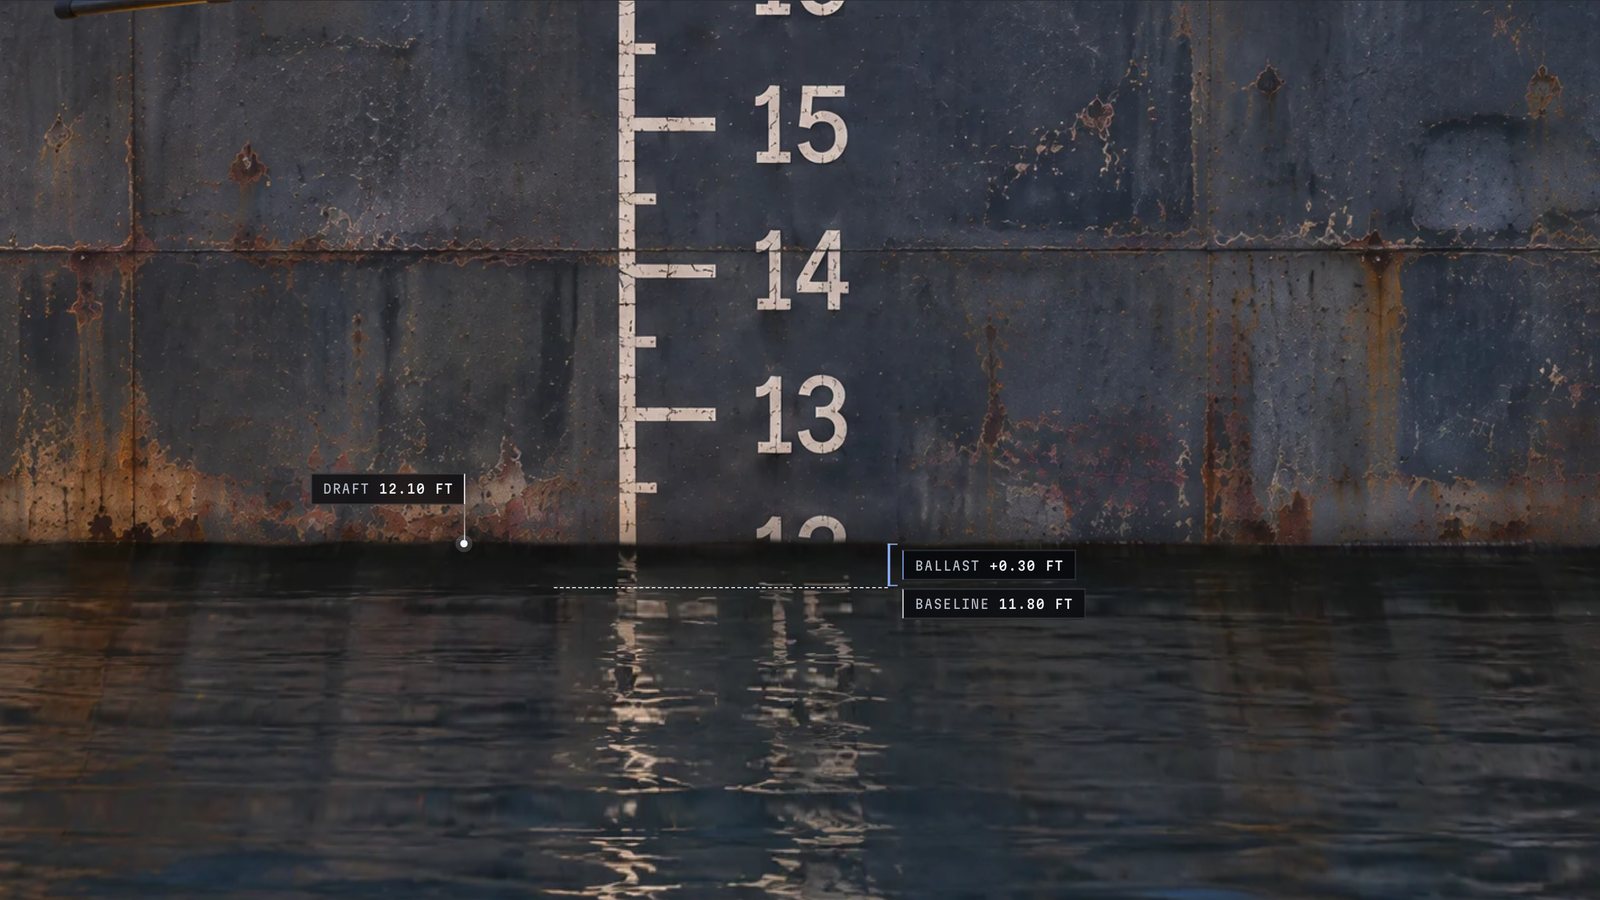
Ballast water is taken on and the barge sits deeper before any cargo arrives. The drone reads the marks again and the rise is logged as ballast. Because it is recorded here, it is never counted as cargo later.
Illustrative checks
Baseline reference, tank contents, updated readings.
Record for review
Ballast record

Configured values at the end of the phase: mean draft 12.10 ft, 0 of 12 loads aboard, trim 0.00 ft.

03Crane position

Bring the crane to its ready position.

What happens
The crane lowers its boom and brings its open grab over the source barge. The drone scans the surface of the pile, and that scan sets where the grab will bite. The path to the receiving barge is set before the first load.
Illustrative checks
Pile scan, crane target, transfer path.
Record for review
Readiness record

Configured values at the end of the phase: mean draft 12.10 ft, 0 of 12 loads aboard, trim 0.00 ft.

04Cargo load

Follow each load to its own cell.

What happens
Twelve loads cross from barge to barge. Each goes to its own cell of the hold, working from bow to stern and taking the quay side and the water side in turn, so no part of the barge carries more than its share. The drone scans the pile before every bite, and every load leaves its own records: scan, target, lift, release, settle and return.
Illustrative checks
Scan before each load, twelve cells, in order, six records per load.
Record for review
Transfer history

Configured values at the end of the phase: mean draft 12.62 ft, 12 of 12 loads aboard, trim 0.30 ft.

05Trim correction

Level the vessel before the final readings.

What happens
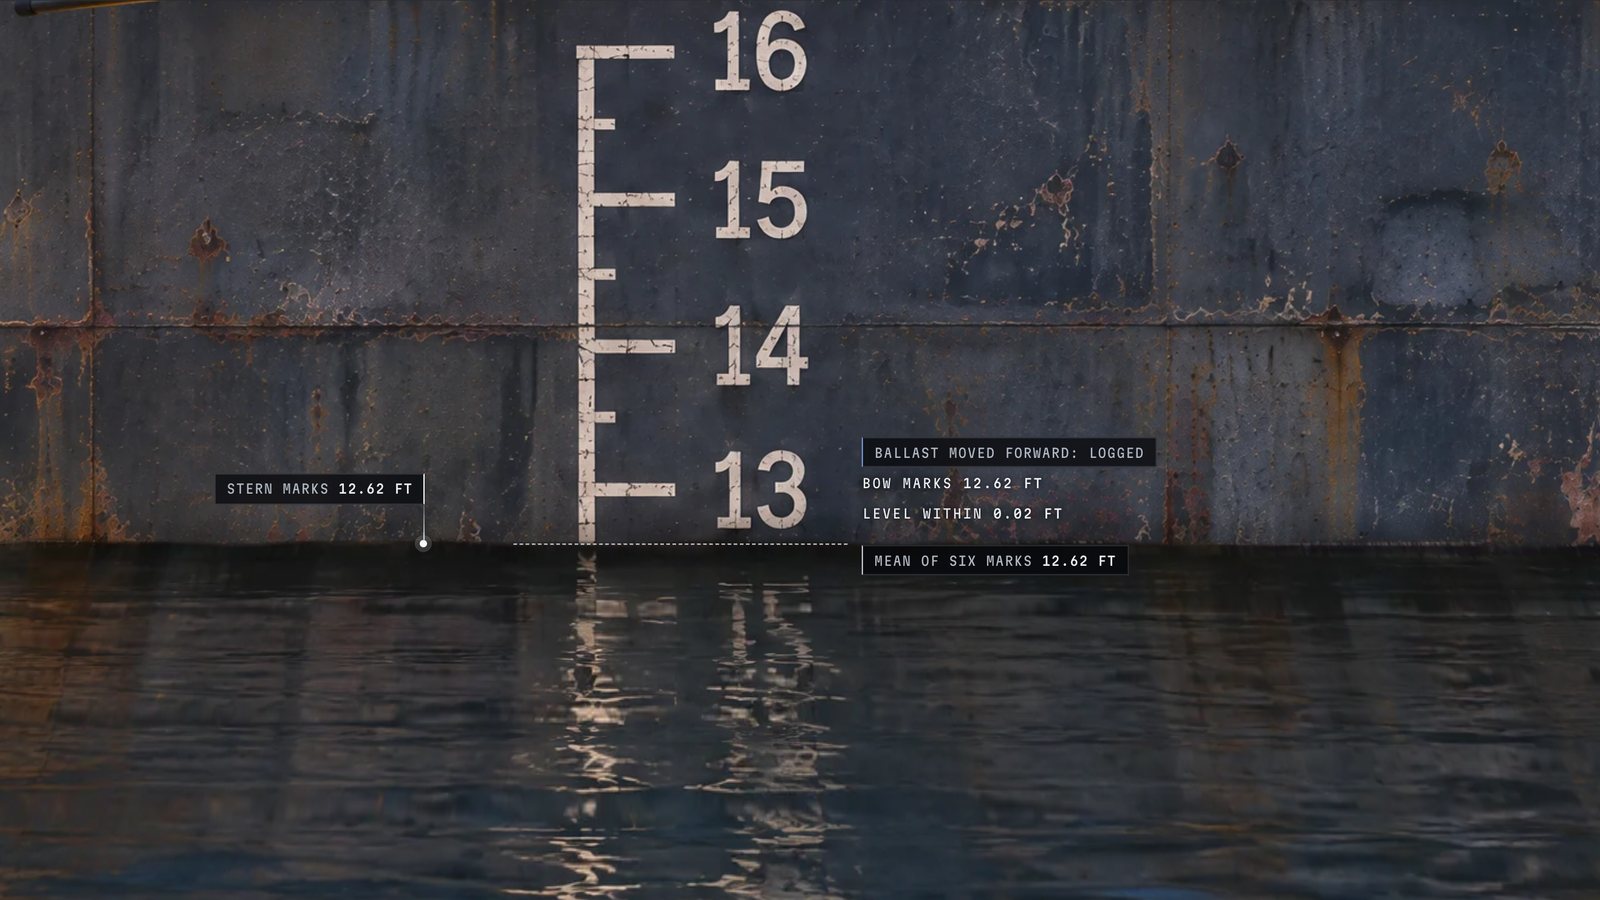
With the cargo aboard, the stern sits a little deeper than the bow. Ballast is pumped from the aft tank to the fore tank until the marks at both ends read alike. No water comes aboard or leaves, so the total is unchanged, and the move is logged.
Illustrative checks
Fore and aft marks, ballast moved, level within tolerance.
Record for review
Trim record

Configured values at the end of the phase: mean draft 12.62 ft, 12 of 12 loads aboard, trim 0.00 ft.

06Final survey

Compare the result with the starting point.

What happens
The drone reads the six marks again and the final readings are set beside the baseline. The rise is split: the part logged as ballast is kept apart, and the rest is cargo. The result, and anything still open, goes to a person for review.
Illustrative checks
Baseline comparison, ballast kept apart, review required.
Record for review
Review package

Configured values at the end of the phase: mean draft 12.62 ft, 12 of 12 loads aboard, trim 0.00 ft.

Part two: the supply hub, step by step.

01Arrive

Twelve pallets wait in the receiving row. Drums, equipment cases, sandbags and totes stand sorted by type. Twelve marked places are ready for them inside the hub. Nothing counts as stored yet.

02Sort and stage

Each pallet goes to its own place. A forklift carries one pallet at a time and sets it down in its assigned place. A pallet on the forks is in transit: it is not counted until it rests. The drums and the cases are in; the sandbags are on their way.

03Count

Twelve places, twelve pallets. Every place holds its pallet and the receiving row is clear. The hub’s drone reads the yard, and the software keeps two numbers apart: what rests in storage now, and the deliveries made during the run.

In the simulation the hub’s work repeats: eight forklifts each carry their pallets into the hub and back to their rows, and both counts are kept for as long as the run lasts.

Part three: the loading bay, step by step.

01Ready

The trailer stands open at its ramp. Its three totes are staged in the marked bay beside it and the forklift waits. Each trailer has its own kind of load: drums for one, equipment cases, sandbags and totes for the others.

02First load, deepest

The first tote goes to the far end. The forklift carries it up the ramp and sets it down against the end wall. The count waits: the load is placed, and it is counted once it rests and the forklift is clear.

03Back toward the doors

The second and third go in front of the first. Each load has its own place, and the earlier ones stay where they were set: nothing is pushed deeper to make room. With the forklift clear of the trailer, the count reads three of three.

04Closed, ready to depart

Doors shut, and the trailer is counted ready. The doors are closed and latched and the ramp is clear. The bay’s drone reads the row of trailers, and the software records this one as ready to depart with its three loads.

In the simulation four trailers load at once, three pallets each: maintenance drums, survey equipment cases, sandbags and totes.

These walkthroughs use configured values and illustrative scenes. They show an intended workflow, not field performance or equipment acceptance, and they are not connected to the survey software or the running simulation.
The survey software

Built and tested with sample figures.

In a test with sample figures, the software calculated that 1,100 tonnes were unloaded. When one figure was corrected, it recalculated 1,200 tonnes and kept the earlier report. It rejected a missing weight and an unclear unit, and flagged figures that conflicted with the stated operation for review.

Sample test figures, not a real cargo operation, a field measurement or a measure of time saved.

What comes next

Three next steps.

  1. 01Show the whole harbour working togetherThe survey, the supply hub and the loading bays run at the same time in the simulation. The next step is to demonstrate them together, with the software’s record open beside the work.
  2. 02Work from the records a business already keepsToday the survey software accepts figures in a set format. Reading the spreadsheets, databases and reports a business already uses is our development direction.
  3. 03Start the next application with a real problemInventory reconciliation is proposed. We are looking for a collaborator with a real business problem and a clear way to judge the result.

Plans, not results. Nothing here has been deployed.

Beyond Harbor

Harbor is the first application.

Inventory reconciliation is a proposed next application.